USD/CAD Price Analysis: Snaps two-day winning streak above the 1.3500 mark


  • USD/CAD recovery loses steam near 1.3510 ahead of the Canadian PMI data. 
  • The pair resumes its uptrend above the key EMA; RSI indicator is above the 50.0 midlines. 
  • The first upside target is seen at 1.3545; the initial support level is located at 1.3460.

The USD/CAD pair loses traction near the intraday low during the early European trading hours on Tuesday. The decline of the US Dollar (USD) acts as a headwind for the pair. Later on Tuesday, the Canadian Ivey Purchasing Managers Index (PMI) for January will be due, which is estimated to ease to 55.0 in January from 56.3 in December. At press time, USD/CAD is trading at 1.3510, down 0.22% on the day.

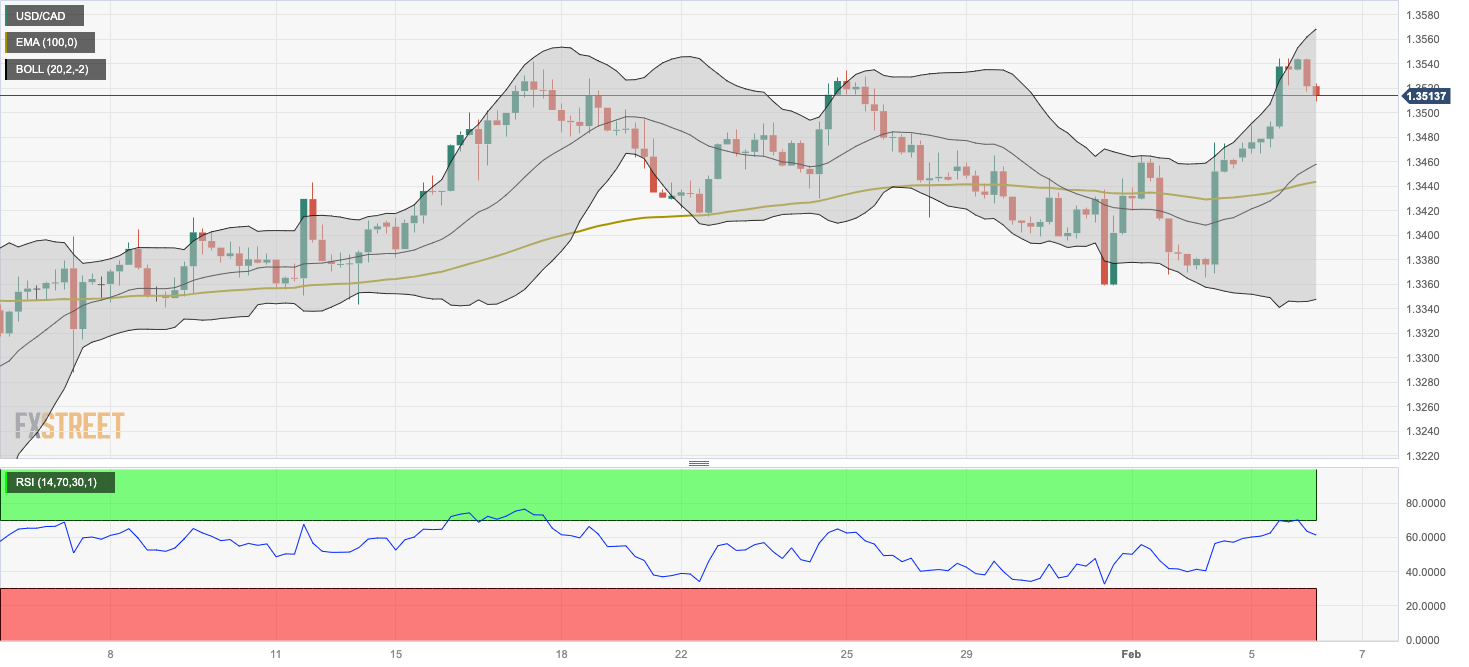
Technically, USD/CAD resumes its uptrend and holds above 100-period Exponential Moving Averages (EMA) on the four-hour chart. Furthermore, the Relative Strength Index (RSI) stands above the 50.0 midlines, hinting that further upside looks favorable. 

The first upside barrier for USD/CAD will emerge near a high of January 5 at 1.3545. Any follow-through buying above the latter will see a rally to the upper boundary of the Bollinger Band at 1.3569. A sustained break could take the pair to a high of December 12 at 1.3618, followed by a high of November 27 at 1.3711. 

In the case of a bearish trading environment, the initial support level is seen near a high of February 1 at 1.3460. The next downside target is located near the 100-period EMA at 1.3443. The additional downside filter to watch is 1.3395 (low of January 20), en route to 1.3365 (low of February 2), and finally at 1.3347 (the lower limit of the Bollinger Band).

USD/CAD four-hour chart


USD/CAD

Overview
Today last price 1.3511
Today Daily Change -0.0029
Today Daily Change % -0.21
Today daily open 1.354
 
Trends
Daily SMA20 1.3449
Daily SMA50 1.3427
Daily SMA100 1.3553
Daily SMA200 1.3477
 
Levels
Previous Daily High 1.3544
Previous Daily Low 1.346
Previous Weekly High 1.3476
Previous Weekly Low 1.3359
Previous Monthly High 1.3542
Previous Monthly Low 1.3229
Daily Fibonacci 38.2% 1.3512
Daily Fibonacci 61.8% 1.3492
Daily Pivot Point S1 1.3486
Daily Pivot Point S2 1.3431
Daily Pivot Point S3 1.3402
Daily Pivot Point R1 1.3569
Daily Pivot Point R2 1.3599
Daily Pivot Point R3 1.3653


Share: Feed news

Information on these pages contains forward-looking statements that involve risks and uncertainties. Markets and instruments profiled on this page are for informational purposes only and should not in any way come across as a recommendation to buy or sell in these assets. You should do your own thorough research before making any investment decisions. FXStreet does not in any way guarantee that this information is free from mistakes, errors, or material misstatements. It also does not guarantee that this information is of a timely nature. Investing in Open Markets involves a great deal of risk, including the loss of all or a portion of your investment, as well as emotional distress. All risks, losses and costs associated with investing, including total loss of principal, are your responsibility. The views and opinions expressed in this article are those of the authors and do not necessarily reflect the official policy or position of FXStreet nor its advertisers. The author will not be held responsible for information that is found at the end of links posted on this page.

If not otherwise explicitly mentioned in the body of the article, at the time of writing, the author has no position in any stock mentioned in this article and no business relationship with any company mentioned. The author has not received compensation for writing this article, other than from FXStreet.

FXStreet and the author do not provide personalized recommendations. The author makes no representations as to the accuracy, completeness, or suitability of this information. FXStreet and the author will not be liable for any errors, omissions or any losses, injuries or damages arising from this information and its display or use. Errors and omissions excepted.

The author and FXStreet are not registered investment advisors and nothing in this article is intended to be investment advice.

Recommended content


Recommended content

Editors’ Picks

EUR/USD stays below 1.1100, looks to post weekly losses

EUR/USD stays below 1.1100, looks to post weekly losses

EUR/USD continues to trade in a narrow range below 1.1100 and remains on track to end the week in negative territory. Earlier in the day, monthly PCE inflation data from the US came in line with the market expectation, failing to trigger a reaction.

EUR/USD News
GBP/USD struggles to find a foothold, trades near 1.3150

GBP/USD struggles to find a foothold, trades near 1.3150

GBP/USD stays on the back foot and trades in negative territory at around 1.3150 on Friday. The US Dollar holds its ground following the July PCE inflation data and doesn't allow the pair to stage a rebound heading into the weekend.

GBP/USD News
Gold retreats toward $2,500 ahead of the weekend

Gold retreats toward $2,500 ahead of the weekend

Gold stays under modest bearish pressure and declines toward $2,500 in the American session on Friday. The 10-year US Treasury bond yield edges higher toward 3.9% after US PCE inflation data, causing XAU/USD to stretch lower.

Gold News
Week ahead – Investors brace for NFP amid Fed rate cut speculation

Week ahead – Investors brace for NFP amid Fed rate cut speculation

Here comes another NFP week, with investors eagerly awaiting the results as they try to discern the size and pace of the Fed’s forthcoming rate cuts. The weaker than expected July numbers triggered market turbulence, instilling fears about a potential recession in the US.

Read more
Easing Eurozone inflation to back an ECB rate cut in September

Easing Eurozone inflation to back an ECB rate cut in September Premium

Eurostat will publish the preliminary estimate of the August Eurozone Harmonized Index of Consumer Prices on Friday, and the anticipated outcome will back up the case for another European Central Bank interest rate cut when policymakers meet in September.

Read more
Moneta Markets review 2024: All you need to know

Moneta Markets review 2024: All you need to know

VERIFIED In this review, the FXStreet team provides an independent and thorough analysis based on direct testing and real experiences with Moneta Markets – an excellent broker for novice to intermediate forex traders who want to broaden their knowledge base.

Read More

Forex MAJORS

Cryptocurrencies

Signatures