USD/CAD Price Analysis: Recovery remains elusive below 1.3790 hurdle


  • USD/CAD clings to mild gains after bouncing off short-term key technical supports.
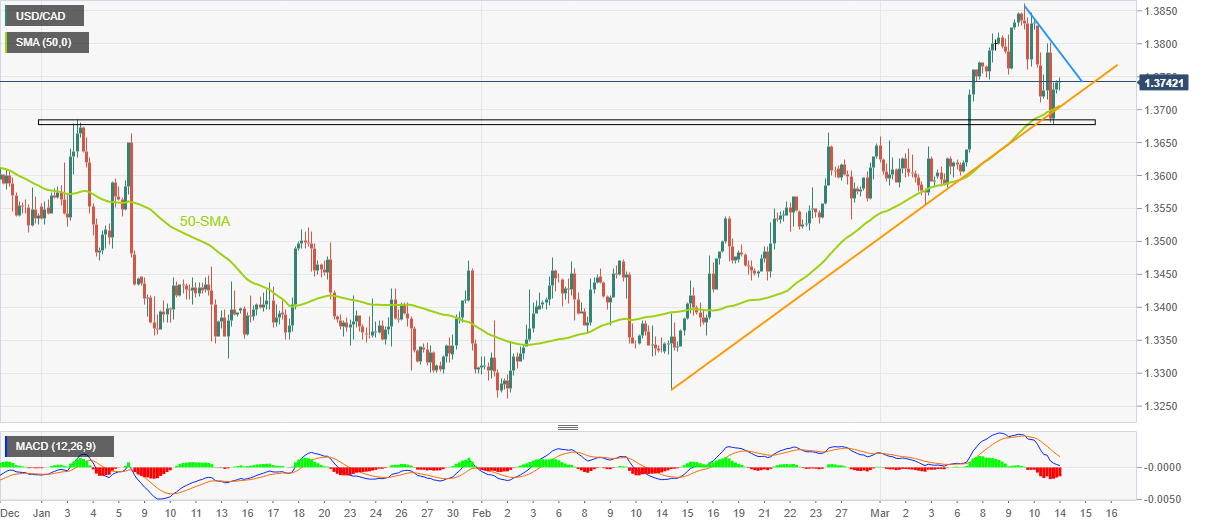
  • Convergence of 50-SMA, one-month-old ascending trend line restricts immediate downside.
  • Horizontal area comprising early January lows adds to the downside filters.
  • Descending resistance line from Friday, bearish MACD signals challenge Loonie pair buyers.

USD/CAD bulls struggle to keep the latest rebound from a one-week low around 1.3750 during early Tuesday. Even so, the Loonie pair sellers have a tough road on the south before retaking control as the quote consolidates the biggest daily slump in a month.

That said, the pair bounced off early January tops the previous day, as well as portrayed a sustained recovery from the one-month-old ascending support line and the 50-SMA.

However, the bearish MACD signals and the Loonie pair’s inaction raises doubts on the quote’s further upside.

Also challenging the USD/CAD bulls is a downward-sloping resistance line from Friday, close to 1.3790 at the latest.

Even if the quote manages to remain firmer past 1.3790, it needs to remain firmer past the 1.3800 round figure ahead of challenging the monthly high surrounding 1.3860.

On the flip side, a convergence of the 50-SMA and aforementioned support line from the mid-February, around 1.3700 at the latest, appears the short-term key support for the USD/CAD sellers to watch during the quote’s pullback.

Should the quote drops below 1.3700 mark, the horizontal area comprising levels marked since early January, close to 1.3685-80, may gain the USD/CAD bear’s attention as a break of which won’t hesitate to challenge the monthly low marked in the last week around 1.3555.

USD/CAD: Four-hour chart

Trend: Limited upside expected

Additional important levels

Overview
Today last price 1.3739
Today Daily Change 0.0008
Today Daily Change % 0.06%
Today daily open 1.3731
 
Trends
Daily SMA20 1.3596
Daily SMA50 1.3483
Daily SMA100 1.3504
Daily SMA200 1.3319
 
Levels
Previous Daily High 1.3828
Previous Daily Low 1.3677
Previous Weekly High 1.3862
Previous Weekly Low 1.3582
Previous Monthly High 1.3666
Previous Monthly Low 1.3262
Daily Fibonacci 38.2% 1.3735
Daily Fibonacci 61.8% 1.377
Daily Pivot Point S1 1.3663
Daily Pivot Point S2 1.3594
Daily Pivot Point S3 1.3512
Daily Pivot Point R1 1.3814
Daily Pivot Point R2 1.3896
Daily Pivot Point R3 1.3964


Share: Feed news

Information on these pages contains forward-looking statements that involve risks and uncertainties. Markets and instruments profiled on this page are for informational purposes only and should not in any way come across as a recommendation to buy or sell in these assets. You should do your own thorough research before making any investment decisions. FXStreet does not in any way guarantee that this information is free from mistakes, errors, or material misstatements. It also does not guarantee that this information is of a timely nature. Investing in Open Markets involves a great deal of risk, including the loss of all or a portion of your investment, as well as emotional distress. All risks, losses and costs associated with investing, including total loss of principal, are your responsibility. The views and opinions expressed in this article are those of the authors and do not necessarily reflect the official policy or position of FXStreet nor its advertisers. The author will not be held responsible for information that is found at the end of links posted on this page.

If not otherwise explicitly mentioned in the body of the article, at the time of writing, the author has no position in any stock mentioned in this article and no business relationship with any company mentioned. The author has not received compensation for writing this article, other than from FXStreet.

FXStreet and the author do not provide personalized recommendations. The author makes no representations as to the accuracy, completeness, or suitability of this information. FXStreet and the author will not be liable for any errors, omissions or any losses, injuries or damages arising from this information and its display or use. Errors and omissions excepted.

The author and FXStreet are not registered investment advisors and nothing in this article is intended to be investment advice.

XM
Account
7.2
Tools
9.2
Service
9.4
Trading
9.0
Trust
7.0
Experience
8.4
Read review
Moneta Markets
Account
7.4
Tools
6.6
Service
8.0
Trading
6.6
Trust
5.2
Experience
9.2
Read review
Trading Pro
Account
7.2
Tools
5.2
Service
6.6
Trading
8.0
Trust
5.0
Experience
7.0
Read review
Pepperstone
Account
8.2
Tools
8.2
Service
7.4
Trading
9.0
Trust
8.8
Experience
9.0
Read review
XM
Read review
Moneta Markets
Read review
Trading Pro
Read review
Pepperstone
Read review
Trading Pro
Read review
Pepperstone
Read review
XM
Read review
Moneta Markets
Read review
Trading Pro
Account
7.2
Tools
5.2
Service
6.6
Trading
8.0
Trust
5.0
Experience
7.0
Read review
Pepperstone
Account
8.2
Tools
8.2
Service
7.4
Trading
9.0
Trust
8.8
Experience
9.0
Read review
XM
Account
7.2
Tools
9.2
Service
9.4
Trading
9.0
Trust
7.0
Experience
8.4
Read review
Moneta Markets
Account
7.4
Tools
6.6
Service
8.0
Trading
6.6
Trust
5.2
Experience
9.2
Read review

Recommended content


Recommended content

Editors’ Picks

EUR/USD drops below 1.1400 after US PMI data

EUR/USD drops below 1.1400 after US PMI data

EUR/USD comes under renewed bearish pressure in the American session and trades below 1.1400. Upbeat PMI data from the US and a Wall Street Journal report claiming that the White House is considering slashing tariffs on Chinese imports support the USD and weigh on the pair.

EUR/USD News
GBP/USD retreats below 1.3300 as USD rebounds

GBP/USD retreats below 1.3300 as USD rebounds

GBP/USD stays under bearish pressure and trades below 1.3300 on Wednesday. The US Dollar benefits from the upbeat PMI data and easing fears over a further escalation in the US-China trade conflict, causing the pair to push lower.

GBP/USD News
Gold slumps below $3,300 on signs of de-escalation of US-China trade conflict

Gold slumps below $3,300 on signs of de-escalation of US-China trade conflict

Gold extends its decline and trades below $3,300 in the second half of the day on Wednesday. The Wall Street Journal reported that the Trump administration was considering to lower tariffs on Chinese goods, reviving optimism about a de-escalation in the trade war and causing Gold to lose interest as a safe-haven.

Gold News
Bitcoin bullish momentum builds as premium exceeds 9% for first time in three months

Bitcoin bullish momentum builds as premium exceeds 9% for first time in three months

Bitcoin price is extending its gains, trading above $94,000 at the time of writing on Wednesday, following a two-day rally of 9.75% so far this week. BTC rally gathers momentum as trade war fears ease, following US President Donald Trump’s downplaying of tensions with China.

Read more
Five fundamentals for the week: Traders confront the trade war, important surveys, key Fed speech

Five fundamentals for the week: Traders confront the trade war, important surveys, key Fed speech Premium

Will the US strike a trade deal with Japan? That would be positive progress. However, recent developments are not that positive, and there's only one certainty: headlines will dominate markets. Fresh US economic data is also of interest.

Read more
The Best brokers to trade EUR/USD

The Best brokers to trade EUR/USD

SPONSORED Discover the top brokers for trading EUR/USD in 2025. Our list features brokers with competitive spreads, fast execution, and powerful platforms. Whether you're a beginner or an expert, find the right partner to navigate the dynamic Forex market.

Read More

Forex MAJORS

Cryptocurrencies

Signatures

Best Brokers of 2025