- USD/CAD moves sideways after halting a winning streak that began on December 27.
- MACD indicator suggests a potential shift in the pair’s direction.
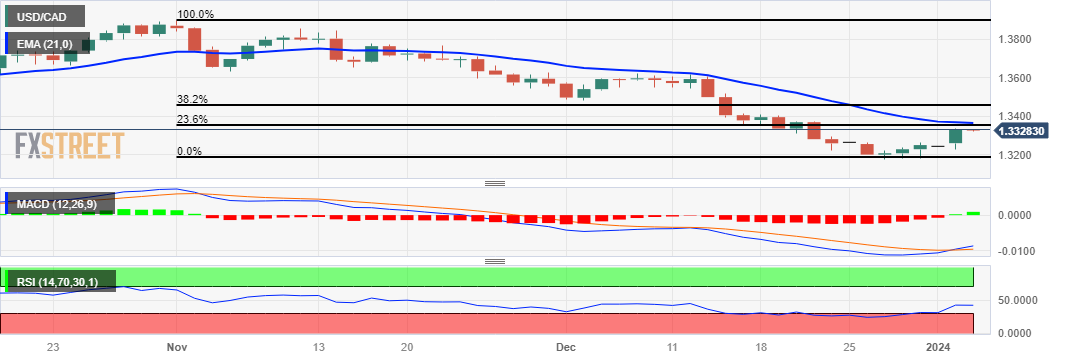
- A break above the 23.6% Fibonacci retracement at 1.3351 could lead the pair to surpass the 21-day EMA at 1.3363.
USD/CAD hovers near 1.3330 during the Asian session on Wednesday. The USD/CAD pair receives upward support as investors turn back to the US Dollar (USD) on risk-off sentiment.
The technical analysis of the Moving Average Convergence Divergence (MACD) for the USD/CAD pair suggests a potential shift in the pair's trend as the MACD line lies below the centreline but shows divergence above the signal line.
However, the lagging indicator 14-day Relative Strength Index (RSI) is positioned below 50. Traders will likely wait for confirmation implying that the USD/CAD pair could change its direction.
The USD/CAD pair could find key support near the psychological level at 1.3300 following the major support at 1.3250 level. A break below the latter could push the pair to navigate the region around the weekly low at 1.3228 followed by the psychological level at 1.3200.
The analysis suggests that on the upside, the major level at 1.3350 aligned with the 23.6% Fibonacci retracement level at 1.3351 could act as a key resistance zone. A breakthrough above the key resistance zone could lead the USD/CAD pair to surpass the 21-day Exponential Moving Average (EMA) at 1.3363 following the psychological barrier at 1.3400.
If the USD/CAD pair manages to pass through the psychological resistance, it may explore further upward movement toward the 38.2% Fibonacci retracement level at 1.3456.
USD/CAD: Daily Chart
Information on these pages contains forward-looking statements that involve risks and uncertainties. Markets and instruments profiled on this page are for informational purposes only and should not in any way come across as a recommendation to buy or sell in these assets. You should do your own thorough research before making any investment decisions. FXStreet does not in any way guarantee that this information is free from mistakes, errors, or material misstatements. It also does not guarantee that this information is of a timely nature. Investing in Open Markets involves a great deal of risk, including the loss of all or a portion of your investment, as well as emotional distress. All risks, losses and costs associated with investing, including total loss of principal, are your responsibility. The views and opinions expressed in this article are those of the authors and do not necessarily reflect the official policy or position of FXStreet nor its advertisers. The author will not be held responsible for information that is found at the end of links posted on this page.
If not otherwise explicitly mentioned in the body of the article, at the time of writing, the author has no position in any stock mentioned in this article and no business relationship with any company mentioned. The author has not received compensation for writing this article, other than from FXStreet.
FXStreet and the author do not provide personalized recommendations. The author makes no representations as to the accuracy, completeness, or suitability of this information. FXStreet and the author will not be liable for any errors, omissions or any losses, injuries or damages arising from this information and its display or use. Errors and omissions excepted.
The author and FXStreet are not registered investment advisors and nothing in this article is intended to be investment advice.


Recommended content
Editors’ Picks

EUR/USD challenges 1.1300, drops to daily lows
The US Dollar's recovery is now picking up extra impulse, sending EUR/USD back to the 1.1300 region and reversing at the same time two consecutive daily advances. In the meantime, investors continue to closely follow developments arounnd the US-China trade crisis.

GBP/USD faces some downside pressure, returns to the low-1.3100s
GBP/USD is now relinquishing part of its earlier advance toward the 1.3200 neighbourhood, receding to the 1.3130-1.3120 band on the back of the rebound in the Greenback and steady anxiety surrounding the tariff narrative.

Gold comes under pressure, breaches $3,200
Gold extends further its correction from earlier record highs near $3,250 amid some apparent alleviated trade concerns and the renewed buying interest in the Greenback. Declining US yields, in the meantime, should keep the downside contained somehow.

Six Fundamentals for the Week: Tariffs, US Retail Sales and ECB stand out Premium
"Nobody is off the hook" – these words by US President Donald Trump keep markets focused on tariff policy. However, some hard data and the European Central Bank (ECB) decision will also keep things busy ahead of Good Friday.

Is a recession looming?
Wall Street skyrockets after Trump announces tariff delay. But gains remain limited as Trade War with China continues. Recession odds have eased, but investors remain fearful. The worst may not be over, deeper market wounds still possible.

The Best brokers to trade EUR/USD
SPONSORED Discover the top brokers for trading EUR/USD in 2025. Our list features brokers with competitive spreads, fast execution, and powerful platforms. Whether you're a beginner or an expert, find the right partner to navigate the dynamic Forex market.