|

USD/CAD Price Analysis: Justifies Friday’s Doji to drop towards 200-DMA below 1.3500

  • USD/CAD takes offers to refresh intraday low, defends the previous week’s downbeat performance.
  • Loonie pair remains pressured between 100-DMA and 200-DMA.
  • Bearish candlestick formation, unimpressive oscillators suggest further grinding of USD/CAD price.
  • Descending resistance line from early March, two-week-old rising support line act as additional downside filters.

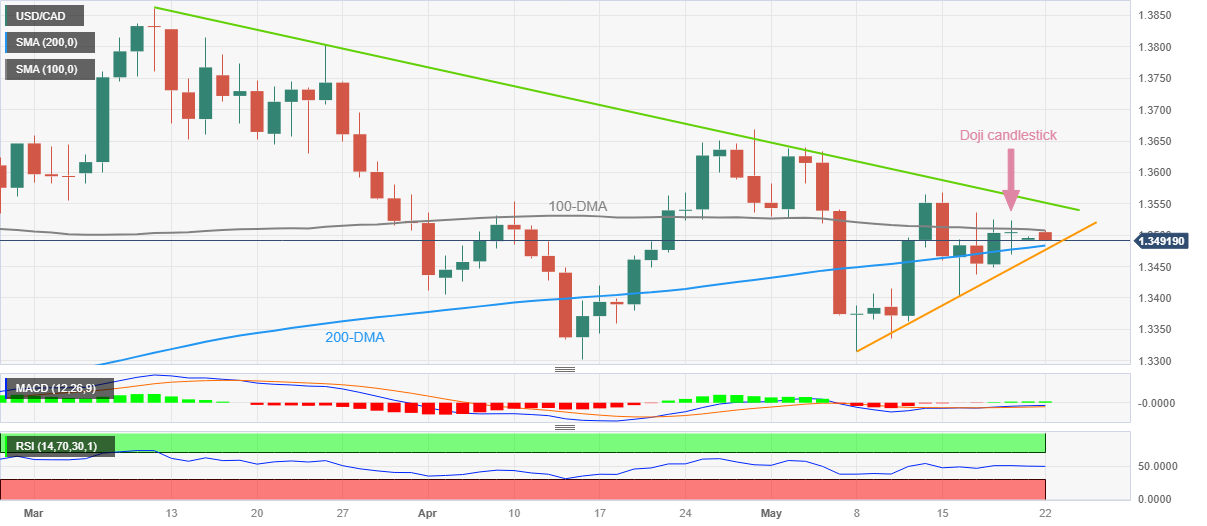
USD/CAD renews its intraday low near 1.3490 during early Monday morning in Europe. In doing so, The Loonie pair justifies Friday’s Doji candlestick, as well as a steady RSI (14) line and bullish MACD signals.

With this, the USD/CAD pair is likely to remain sidelined between the 100-DMA and 200-DMA, respectively near 1.3510 and 1.3480.

It’s worth noting that the Loonie pair’s downside break of 1.3480 allows it to take a chance about further bearish bias over the USD/CAD pair as it needs to cross a two-week-old upward-sloping support line, close to 1.3475 by the press time.

Following that, the USD/CAD fall towards the 1.3400 round figure and then to the yearly low of around 1.3300 can’t be ruled out.

On the flip side, a daily closing beyond the 100-DMA hurdle of around 1.3510 isn’t an open welcome to the USD/CAD bulls as a downward-sloping resistance line from March, close to 1.3550, appears a tough nut to crack for the pair buyers.

In a case where the USD/CAD manages to stay firmer beyond 1.3550, a gradual run-up toward the previous monthly low of around 1.3665 can’t be ruled out.

Overall, USD/CAD is likely to remain sidelined but the bears have upper hand of late.

USD/CAD: Daily chart

Trend: Limited downside expected

Additional important levels

Overview
Today last price1.3497
Today Daily Change-0.0008
Today Daily Change %-0.06%
Today daily open1.3505
 
Trends
Daily SMA201.3512
Daily SMA501.3541
Daily SMA1001.351
Daily SMA2001.3477
 
Levels
Previous Daily High1.3524
Previous Daily Low1.3469
Previous Weekly High1.3568
Previous Weekly Low1.3404
Previous Monthly High1.3668
Previous Monthly Low1.3301
Daily Fibonacci 38.2%1.3503
Daily Fibonacci 61.8%1.349
Daily Pivot Point S11.3474
Daily Pivot Point S21.3444
Daily Pivot Point S31.3419
Daily Pivot Point R11.353
Daily Pivot Point R21.3554
Daily Pivot Point R31.3585

Author

Anil Panchal

Anil Panchal

FXStreet

Anil Panchal has nearly 15 years of experience in tracking financial markets. With a keen interest in macroeconomics, Anil aptly tracks global news/updates and stays well-informed about the global financial moves and their implications.

More from Anil Panchal
Share:

Editor's Picks

EUR/USD challenges 1.1700, six-week lows

EUR/USD remains under heavy downside pressire in quite a dfrreadful start to the new trading week, putting the 1.1700 support to the test amid the marked rebound in the US Dollar. The flight-so-safety environment continues to support the Greenback following the escalating conflict in the Middle East.

GBP/USD hits new yearly lows near 1.3300

GBP/USD adds to the recent bearish tone, approaching to the key 1.3300 support to reach fresh YTD troughs against the backdrop of the robust performance of the US Dollar. Indeed, Cable’s decline comes amid the firm demand for the safe-haven space in the wake of the US and Israel attacks to Iran.

Gold shifts its attention to $5,600 on fligh-to-safety mood

Gold climbs to levels last seen in late January past the $5,400 mark per troy ounce on Monday. The yellow metal’s strong uptick remains fuelled by incresing geopolitical tensions in the Middle East and the consequent demand for safer assets.

Bitcoin on brink of breakdown amid US-Iran war

Bitcoin (BTC) remains under pressure near the key support level of $65,700. Trading at $66,400 at the time of writing on Monday, a breakdown below this critical level would suggest a deeper correction ahead.

The week ahead: Conflict in the Middle East jolts markets

Events in the Middle East are obviously dominating financial markets this morning. The Brent crude oil price is extending gains and is higher by more than 8%, stock futures are pointing lower and the gold price is higher by more than 2%. 

Pi Network Price Forecast: Core team offloads supply, weighing on PI recovery

Pi Network  hovers below $0.1700, broadly steady at press time on Monday, attempting a recovery after a 2% loss the previous day. Sunday’s decline aligned with nearly 49 million PI tokens offloaded by the Pi Foundation, implying a spike in supply pressure that capped the prevailing four-day recovery.