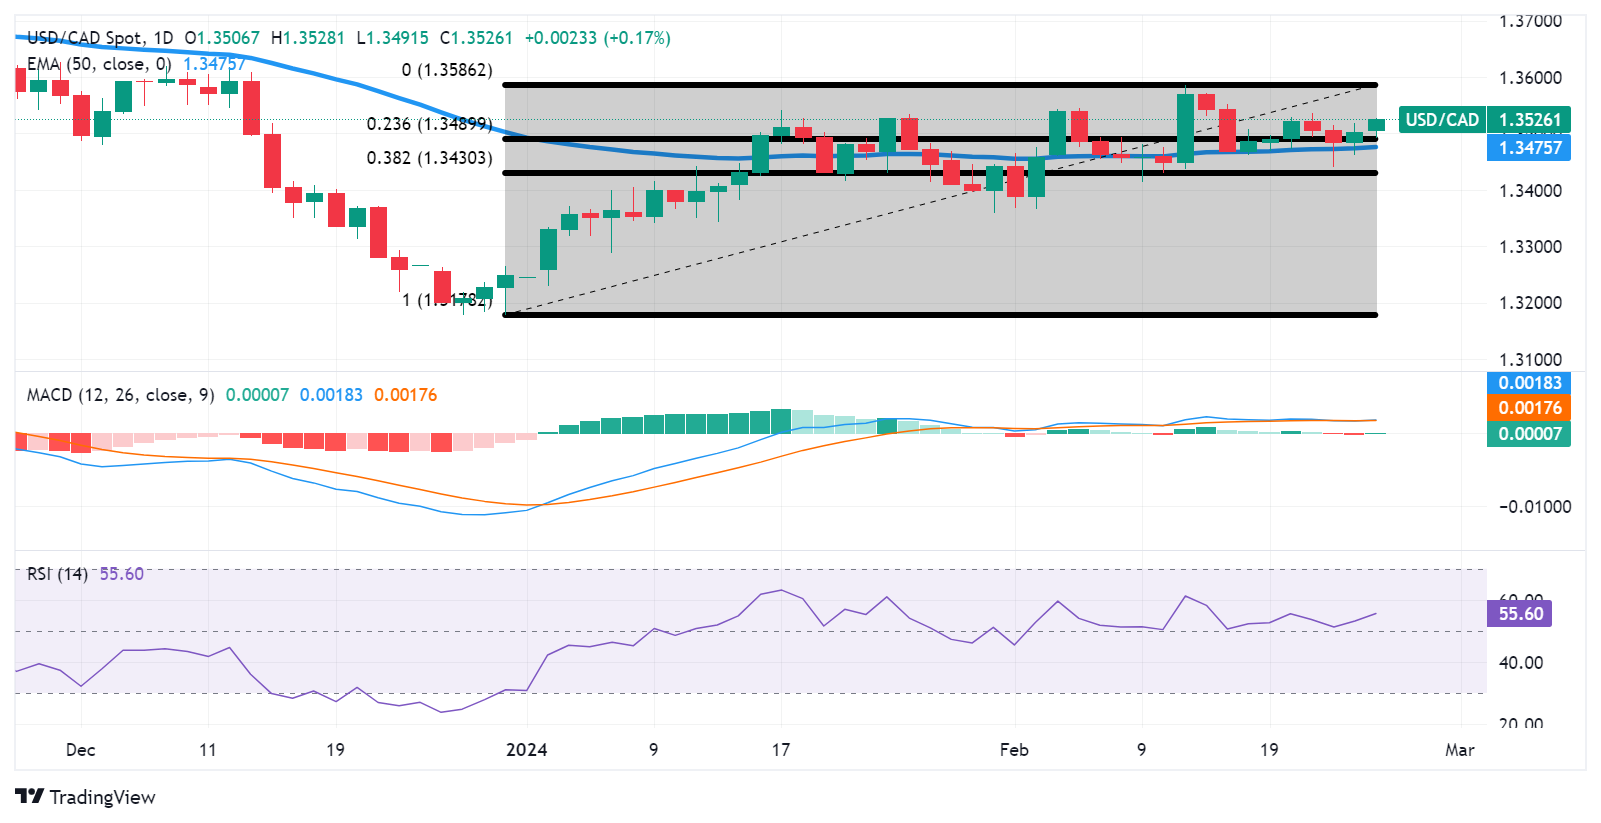
- USD/CAD could breach the key barrier at 1.3550 to test February’s high at 1.3586.
- Traders could await the MACD indicator to confirm a clear directional trend.
- The pair could find immediate support at the psychological level of 1.3500 followed by the 50-day EMA at 1.3475.
USD/CAD moves higher for the second consecutive day, inching higher to near 1.3520 during the European session on Monday. The pair could meet the key barrier at the major level of 1.3550 following February’s high at 1.3586.
A break above the latter could exert upward support to lead the USD/CAD pair to explore the region around the psychological resistance level at 1.3600.
The technical analysis of the 14-day Relative Strength Index (RSI) is positioned above 50, suggesting bullish momentum for the USD/CAD pair.
Furthermore, the Moving Average Convergence Divergence (MACD) indicator for the USD/CAD pair, a lagging indicator, indicates a subdued momentum in the market. This interpretation is based on the MACD line's position above the centerline but resting on the signal line. Traders might prefer to await a clearer directional signal from the MACD indicator before initiating any trading actions.
On the downside, the immediate support appears at the psychological level of 1.3500 followed by the 23.6% Fibonacci retracement level of 1.3489 and the 50-day Exponential Moving Average (EMA) at 1.3475.
The USD/CAD pair could further fall to the major level of 1.3450 before the 38.2% Fibonacci retracement level at 1.3430. A break of this level could put downward pressure on the pair to test the psychological support at the 1.3400 level.
USD/CAD: Daily Chart
Information on these pages contains forward-looking statements that involve risks and uncertainties. Markets and instruments profiled on this page are for informational purposes only and should not in any way come across as a recommendation to buy or sell in these assets. You should do your own thorough research before making any investment decisions. FXStreet does not in any way guarantee that this information is free from mistakes, errors, or material misstatements. It also does not guarantee that this information is of a timely nature. Investing in Open Markets involves a great deal of risk, including the loss of all or a portion of your investment, as well as emotional distress. All risks, losses and costs associated with investing, including total loss of principal, are your responsibility. The views and opinions expressed in this article are those of the authors and do not necessarily reflect the official policy or position of FXStreet nor its advertisers. The author will not be held responsible for information that is found at the end of links posted on this page.
If not otherwise explicitly mentioned in the body of the article, at the time of writing, the author has no position in any stock mentioned in this article and no business relationship with any company mentioned. The author has not received compensation for writing this article, other than from FXStreet.
FXStreet and the author do not provide personalized recommendations. The author makes no representations as to the accuracy, completeness, or suitability of this information. FXStreet and the author will not be liable for any errors, omissions or any losses, injuries or damages arising from this information and its display or use. Errors and omissions excepted.
The author and FXStreet are not registered investment advisors and nothing in this article is intended to be investment advice.
Recommended content
Editors’ Picks

NZD/USD holds steady above YTD low ahead of RBNZ rate decision
NZD/USD remains below mid-0.5800s and closer to the YTD low touched on Tuesday amid bets for another jumbo interest rate cut by RBNZ later today. Moreover, renewed US-China trade war fears undermine antipodean currencies, including the Kiwi, amid the bullish USD sentiment, bolstered by expectations for a slower Fed rate-cutting cycle.

USD/JPY drops to multi-week low, further below 153.00
USD/JPY slides to over a two-week low on Wednesday as Trump's tariff threats continue to drive haven flows towards the JPY and exert pressure on spot prices. That said, doubts over the BoJ's ability to tighten its monetary policy further should cap gains for the JPY.

Gold price consolidates amid mixed cues; holds comfortably above $2,600
Gold price struggles to capitalize on the overnight bounce from the $2,600 neighborhood or over a one-week low and trades with a mild negative bias on Wednesday. The prevalent risk-on environment, expectations for a less dovish Fed, elevated US bond yields and the underlying bullish sentiment surrounding the USD act as a headwind for the commodity.

Bitcoin remains short of $100K as long-term holders capitalize on recent price rise
Bitcoin (BTC) trades below $95K on Tuesday following increased selling pressure among long-term holders (LTH) after a series of new all-time highs (ATH).

Eurozone PMI sounds the alarm about growth once more
The composite PMI dropped from 50 to 48.1, once more stressing growth concerns for the eurozone. Hard data has actually come in better than expected recently – so ahead of the December meeting, the ECB has to figure out whether this is the PMI crying wolf or whether it should take this signal seriously. We think it’s the latter.

Best Forex Brokers with Low Spreads
VERIFIED Low spreads are crucial for reducing trading costs. Explore top Forex brokers offering competitive spreads and high leverage. Compare options for EUR/USD, GBP/USD, USD/JPY, and Gold.