- USD/CAD could test the lower boundary of the rising channel, potentially rebounding to re-enter the rising channel.
- Further movements on the 14-day RSI will provide a clearer directional indication.
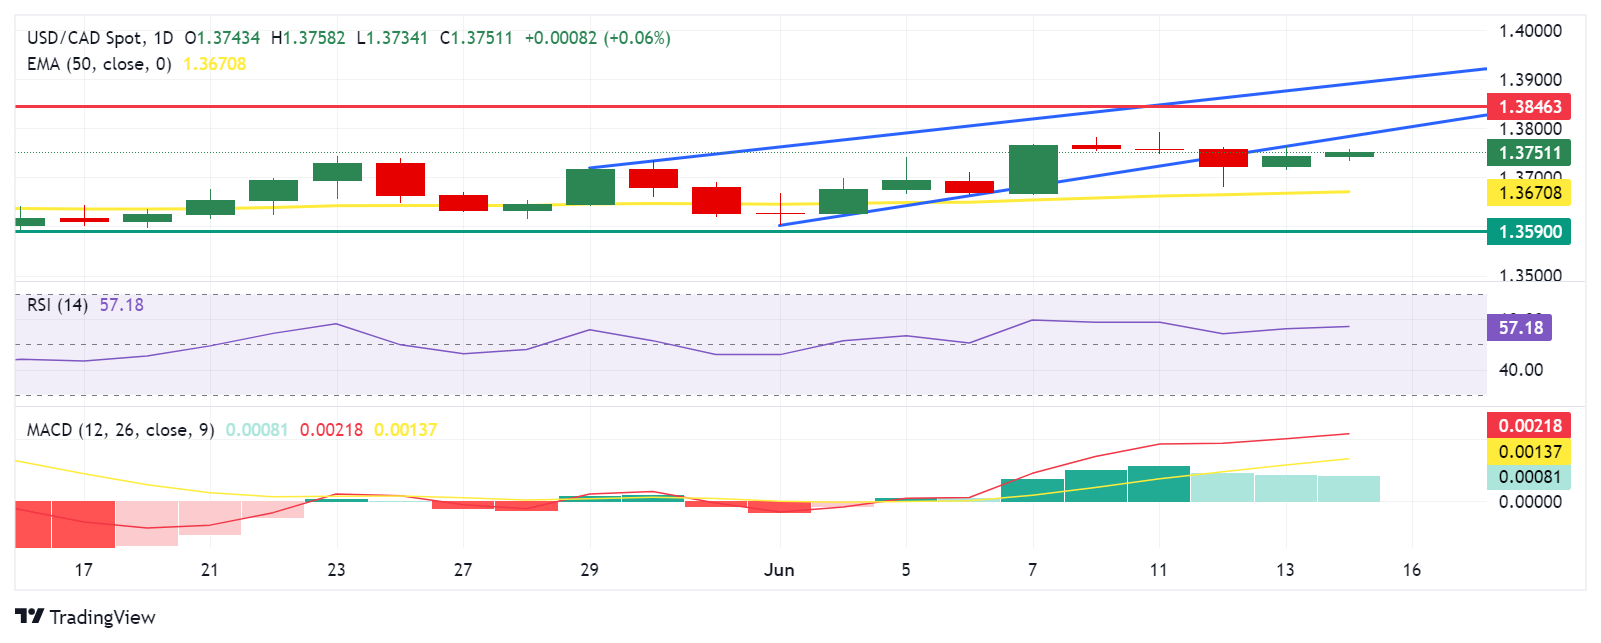
- The pair could find key support at the psychological level of 1.3700 and the 50-day EMA of 1.3670 level.
USD/CAD extends its gains for the second day, trading around 1.3750 during early European hours on Friday. Analysis of the daily chart indicates a weakening bullish bias for the USD/CAD pair, as it struggles to re-enter the rising channel pattern. Despite this, the 14-day Relative Strength Index (RSI) remains above the 50 level, suggesting that the bullish momentum is not entirely lost. Further price movements will be needed to provide a clearer directional indication.
Additionally, the momentum indicator Moving Average Convergence Divergence (MACD) suggests an upward trend for the USD/CAD pair, as the MACD line is positioned above the centerline and shows divergence above the signal line. This indicates that the bullish momentum may continue and support the pair to return to the rising channel pattern.
The USD/CAD pair may test the lower boundary of the rising channel around 1.3780, followed by the key barrier at the psychological level of 1.3800. Further support is found at April’s high of 1.3846. A break above this level could lead the USD/CAD pair to approach the upper threshold of the rising channel around 1.3890.
On the downside, the USD/CAD pair could find immediate support at the psychological level of 1.3700, which aligns with the 50-day Exponential Moving Average (EMA) at 1.3670. A break below this level could exert pressure on the pair, pushing it toward the throwback support region around 1.3590.
USD/CAD: Daily Chart
Information on these pages contains forward-looking statements that involve risks and uncertainties. Markets and instruments profiled on this page are for informational purposes only and should not in any way come across as a recommendation to buy or sell in these assets. You should do your own thorough research before making any investment decisions. FXStreet does not in any way guarantee that this information is free from mistakes, errors, or material misstatements. It also does not guarantee that this information is of a timely nature. Investing in Open Markets involves a great deal of risk, including the loss of all or a portion of your investment, as well as emotional distress. All risks, losses and costs associated with investing, including total loss of principal, are your responsibility. The views and opinions expressed in this article are those of the authors and do not necessarily reflect the official policy or position of FXStreet nor its advertisers. The author will not be held responsible for information that is found at the end of links posted on this page.
If not otherwise explicitly mentioned in the body of the article, at the time of writing, the author has no position in any stock mentioned in this article and no business relationship with any company mentioned. The author has not received compensation for writing this article, other than from FXStreet.
FXStreet and the author do not provide personalized recommendations. The author makes no representations as to the accuracy, completeness, or suitability of this information. FXStreet and the author will not be liable for any errors, omissions or any losses, injuries or damages arising from this information and its display or use. Errors and omissions excepted.
The author and FXStreet are not registered investment advisors and nothing in this article is intended to be investment advice.
Recommended content
Editors’ Picks

EUR/USD nears 1.1200 after US PCE inflation data
EUR/USD approaches 1.1200 following generally softer-than-anticipated US inflation-related figures. The pair lacks momentum amid tepid European data undermining demand for the Euro. Still, optimism weighs on the USD.

GBP/USD battles the 1.3400 level for a definitive bullish breakout
GBP/USD advances modestly beyond the 1.3400 level after US PCE inflation data showed price pressures continued to recede in August. Sterling Pound aims for fresh yearly highs beyond the 1.3433 peak posted earlier this week.

Gold hovers around $2,670 as US Dollar resumes decline
Gold price retains its bullish bias near fresh record highs, as demand for the US Dollar remains subdued following US PCE inflation figures. The strong momentum around stocks limits demand for the safe-haven metal.

Week ahead – NFP on tap amid bets of another bold Fed rate cut
Investors see decent chance of another 50bps cut in November. Fed speakers, ISM PMIs and NFP to shape rate cut bets. Eurozone CPI data awaited amid bets for more ECB cuts. China PMIs and BoJ Summary of Opinions also on tap.

RBA widely expected to keep key interest rate unchanged amid persisting price pressures
The Reserve Bank of Australia is likely to continue bucking the trend adopted by major central banks of the dovish policy pivot, opting to maintain the policy for the seventh consecutive meeting on Tuesday.

Five best Forex brokers in 2024
VERIFIED Choosing the best Forex broker in 2024 requires careful consideration of certain essential factors. With the wide array of options available, it is crucial to find a broker that aligns with your trading style, experience level, and financial goals.