USD/CAD Price Analysis: Extends recovery to 1.3640
- USD/CAD bounces back to 1.3640 amid a firm recovery in the US Dollar.
- Fed officials endorse a restrictive policy stance for longer due to weak conviction over inflation returning to 2%.
- Investors await the Canada CPI data to project the next move in the Canadian Dollar.

The USD/CAD pair rises further to 1.3640 in Friday’s European session. The Loonie asset capitalizes on strong recovery in the US Dollar that is driven by hawkish guidance on interest rates by Federal Reserve (Fed) officials.
The US Dollar Index (DXY) bounces back to 104.75 from a five-week low of 104.00 posted on Thursday. The market sentiment turns cautious as Fed policymakers see one good consumer inflation print as insufficient to build their confidence that price pressures will sustainably return to the desired rate of 2%. Therefore, Fed policymakers emphasized keeping interest rates at their current levels for a longer period. This scenario is favorable for interest-bearish assets, such as bond yields. 10-year US Treasury yields rise to 4.39%. S&P 500 futures remain subdued in the European session.
Meanwhile, investors await Canada’s Consumer Price Index (CPI) data for April, which will be published on Tuesday. The consumer inflation data will significantly influence market expectations for rate cuts by the Bank of Canada (BoC), which investors expect will begin from the June meeting.
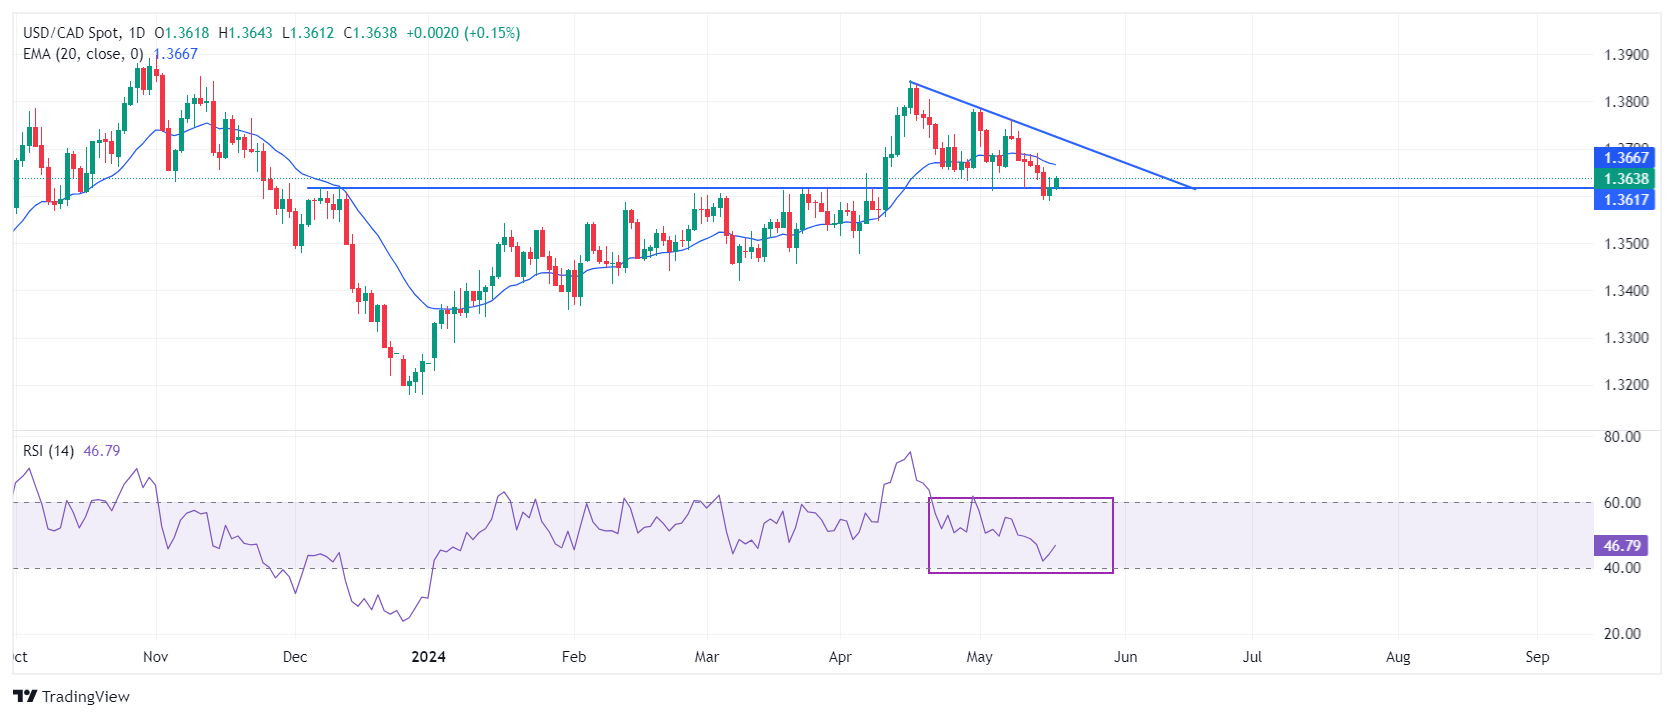
USD/CAD rebounds after discovering buying interest near the horizontal support plotted from December 7 high at 1.3620 on a daily timeframe. The downward-sloping trendline from April 16 high at 1.3846 is acting as a major carrier for the US Dollar bulls. The near-term outlook is uncertain as the asset is trading below the 20-day Exponential Moving Average (EMA), which trades around 1.3667.
The 14-period Relative Strength Index (RSI) remains inside the 40.00-60.00 range, suggesting a sharp volatility contraction.
Fresh buying opportunity would emerge if the asset breaks above April 30 high at 1.3785. This would drive the asset towards April 17 high at 1.3838, followed by the round-level resistance of 1.3900.
In an alternate scenario, a breakdown below May 3 low around 1.3600 will expose the asset to the April 9 low around 1.3547 and the psychological support of 1.3500.
USD/CAD daily chart
Economic Indicator
BoC Consumer Price Index Core (YoY)
The BoC Consumer Price Index Core, released by the Bank of Canada (BoC) on a monthly basis, represents changes in prices for Canadian consumers by comparing the cost of a fixed basket of goods and services. It is considered a measure of underlying inflation as it excludes eight of the most-volatile components: fruits, vegetables, gasoline, fuel oil, natural gas, mortgage interest, intercity transportation and tobacco products. The YoY reading compares prices in the reference month to the same month a year earlier. Generally, a high reading is seen as bullish for the Canadian Dollar (CAD), while a low reading is seen as bearish.
Read more.Next release: Tue May 21, 2024 12:30
Frequency: Monthly
Consensus: -
Previous: 2%
Source: Statistics Canada
Author

Sagar Dua
FXStreet
Sagar Dua is associated with the financial markets from his college days. Along with pursuing post-graduation in Commerce in 2014, he started his markets training with chart analysis.


