|

USD/CAD Price Analysis: Extends pullback from short-term key resistance to 1.3600

  • USD/CAD holds lower ground during two-day retreat from monthly high.
  • Bearish MACD signals add strength to pullback moves targeting previous resistance line.
  • Loonie pair’s recovery needs validation from April’s peak.

USD/CAD remains mildly offered near 1.3600 as it defends the previous day’s U-turn from a one-month high during Monday’s sluggish Asian session, especially amid the holidays in the US.

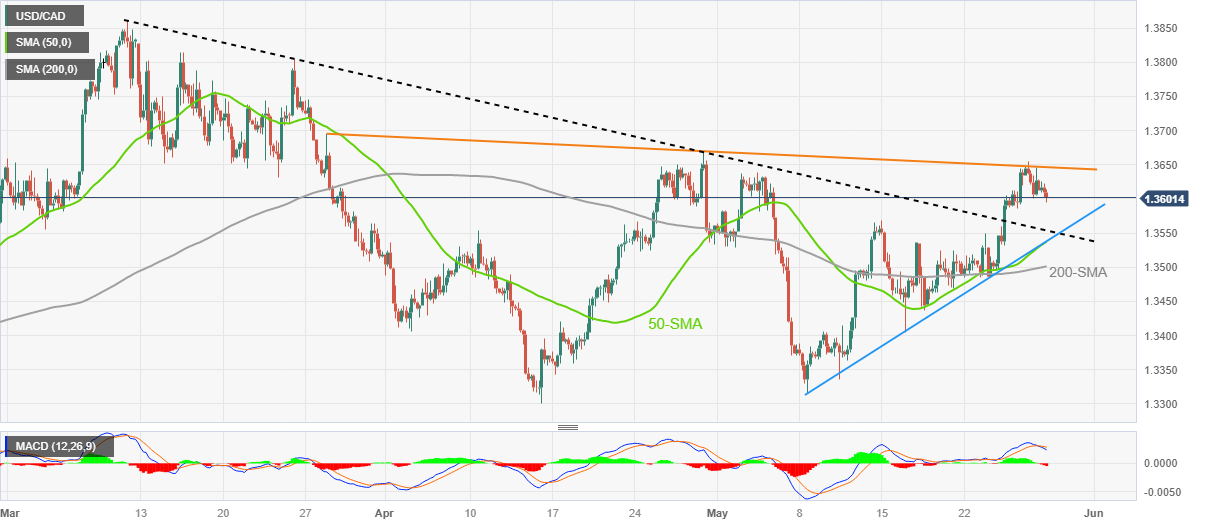
That said, the Loonie pair’s latest weakness justifies its inability to cross a two-month-old descending resistance line, around 1.3650 by the press time. Adding strength to the downside bias are the bearish MACD signals.

With this, the USD/CAD sellers are all set to prod the previous resistance line stretched from early March, close to 1.3550. However, a convergence of the 50-SMA and a three-week-old support line, near 1.3535 at the latest, could challenge the Loonie pair’s further downside.

Even if the quote breaks the 1.3535 support confluence, the 200-SMA level of around 1.3500 can act as the last defense of the USD/CAD buyers before giving control to the Loonie pair bears.

On the contrary, the aforementioned two-month-old resistance line, close to 1.3650, restricts the immediate upside of the pair ahead of the previous monthly high of around 1.3665-70.

Following that, the late March swing high near 1.3700 may act as an additional check for the USD/CAD buyers before targeting the yearly high marked in March around 1.3860.

Overall, USD/CAD is likely to witness further downside but the room towards the south is limited.

USD/CAD: Four-hour chart

Trend: Limited downside expected

Additional important levels

Overview
Today last price1.3603
Today Daily Change-0.0014
Today Daily Change %-0.10%
Today daily open1.3617
 
Trends
Daily SMA201.3507
Daily SMA501.3525
Daily SMA1001.3511
Daily SMA2001.3493
 
Levels
Previous Daily High1.3655
Previous Daily Low1.3601
Previous Weekly High1.3655
Previous Weekly Low1.3485
Previous Monthly High1.3668
Previous Monthly Low1.3301
Daily Fibonacci 38.2%1.3622
Daily Fibonacci 61.8%1.3634
Daily Pivot Point S11.3594
Daily Pivot Point S21.357
Daily Pivot Point S31.354
Daily Pivot Point R11.3648
Daily Pivot Point R21.3678
Daily Pivot Point R31.3702

Author

Anil Panchal

Anil Panchal

FXStreet

Anil Panchal has nearly 15 years of experience in tracking financial markets. With a keen interest in macroeconomics, Anil aptly tracks global news/updates and stays well-informed about the global financial moves and their implications.

More from Anil Panchal
Share:

Markets move fast. We move first.

Orange Juice Newsletter brings you expert driven insights - not headlines. Every day on your inbox.

By subscribing you agree to our Terms and conditions.

Editor's Picks

EUR/USD clings to small gains near 1.1750

Following a short-lasting correction in the early European session, EUR/USD regains its traction and clings to moderate gains at around 1.1750 on Monday. Nevertheless, the pair's volatility remains low, with investors awaiting this weeks key US data releases and the ECB policy announcements.

GBP/USD edges higher toward 1.3400 as traders await key data and BoE

GBP/USD reverses its direction and advances toward 1.3400 following a drop to the 1.3350 area earlier in the day. The US Dollar struggles to gather recovery momentum as markets await Tuesday's Nonfarm Payrolls data, while the Pound Sterling holds steady ahead of the BoE policy announcements later in the week.

Gold builds on previous week's gains, approaches $4,350

Gold preserves its bullish momentum after rising more than 2% last week and climbs toward $4,350 on Monday. The precious metal extends its upside as the US Dollar remains on the back foot on growing expectations for a dovish Fed policy outlook next year.

Solana consolidates as spot ETF inflows near $1 billion signal institutional dip-buying

Solana price hovers above $131 at the time of writing on Monday, nearing the upper boundary of a falling wedge pattern, awaiting a decisive breakout. On the institutional side, demand for spot Solana Exchange-Traded Funds remained firm, pushing total assets under management to nearly $1 billion since launch. 

Big week ends with big doubts

The S&P 500 continued to push higher yesterday as the US 2-year yield wavered around the 3.50% mark following a Federal Reserve (Fed) rate cut earlier this week that was ultimately perceived as not that hawkish after all. The cut is especially boosting the non-tech pockets of the market.

Solana Price Forecast: SOL consolidates as spot ETF inflows near $1 billion signal institutional dip-buying

Solana (SOL) price hovers above $131 at the time of writing on Monday, nearing the upper boundary of a falling wedge pattern, awaiting a decisive breakout.