USD/CAD Price Analysis: Consolidates around 1.3650 within a horizontal channel


  • USD/CAD move sideways within a horizontal channel pattern.
  • The technical indicator MACD suggests an emergence of a bullish bias.
  • The psychological level of 1.3700 appears as the key resistance level.

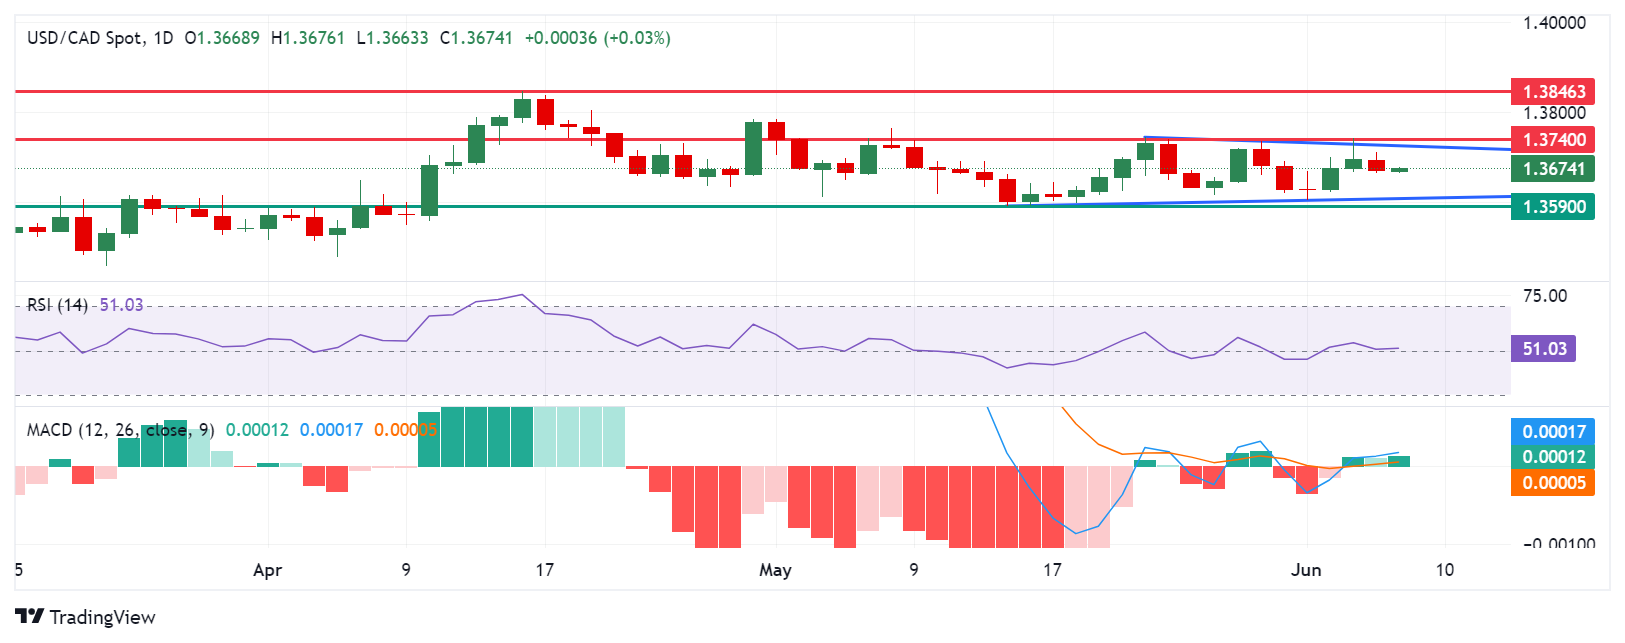
USD/CAD retraces its recent losses, trading around 1.3670 during the early European hours on Friday. Analysis of the daily chart suggests a sideways direction for the USD/CAD pair, as it remains within a horizontal channel pattern.

However, the momentum indicator 14-day Relative Strength Index (RSI) is positioned at the 50 level, and further movement may indicate a clear direction.

Additionally, the Moving Average Convergence Divergence (MACD) indicator suggests an emergence of the bullish bias for the USD/CAD pair. While the MACD line is positioned above the centerline, it shows divergence above the signal line.

On the upside, the USD/CAD pair could find the key barrier at the psychological level of 1.3700. A breakthrough above this level could provide support for the pair to test the upper boundary of the horizontal channel around the level of 1.3720, followed by the pullback resistance at 1.3740.

A surpassing of the latter could lead the USD/CAD pair to explore the region around the key level of 1.3800, followed by April’s high of 1.3846.

On the downside, the USD/CAD pair could find key support around the lower threshold of the horizontal channel around the psychological level of 1.3600, aligned with the throwback support at 1.3590.

USD/CAD: Daily Chart

USD/CAD

Overview
Today last price 1.3672
Today Daily Change 0.0001
Today Daily Change % 0.01
Today daily open 1.3671
 
Trends
Daily SMA20 1.3658
Daily SMA50 1.3669
Daily SMA100 1.3587
Daily SMA200 1.3577
 
Levels
Previous Daily High 1.371
Previous Daily Low 1.3664
Previous Weekly High 1.3735
Previous Weekly Low 1.3615
Previous Monthly High 1.3783
Previous Monthly Low 1.359
Daily Fibonacci 38.2% 1.3682
Daily Fibonacci 61.8% 1.3693
Daily Pivot Point S1 1.3653
Daily Pivot Point S2 1.3636
Daily Pivot Point S3 1.3608
Daily Pivot Point R1 1.3699
Daily Pivot Point R2 1.3727
Daily Pivot Point R3 1.3745


Share: Feed news

Information on these pages contains forward-looking statements that involve risks and uncertainties. Markets and instruments profiled on this page are for informational purposes only and should not in any way come across as a recommendation to buy or sell in these assets. You should do your own thorough research before making any investment decisions. FXStreet does not in any way guarantee that this information is free from mistakes, errors, or material misstatements. It also does not guarantee that this information is of a timely nature. Investing in Open Markets involves a great deal of risk, including the loss of all or a portion of your investment, as well as emotional distress. All risks, losses and costs associated with investing, including total loss of principal, are your responsibility. The views and opinions expressed in this article are those of the authors and do not necessarily reflect the official policy or position of FXStreet nor its advertisers. The author will not be held responsible for information that is found at the end of links posted on this page.

If not otherwise explicitly mentioned in the body of the article, at the time of writing, the author has no position in any stock mentioned in this article and no business relationship with any company mentioned. The author has not received compensation for writing this article, other than from FXStreet.

FXStreet and the author do not provide personalized recommendations. The author makes no representations as to the accuracy, completeness, or suitability of this information. FXStreet and the author will not be liable for any errors, omissions or any losses, injuries or damages arising from this information and its display or use. Errors and omissions excepted.

The author and FXStreet are not registered investment advisors and nothing in this article is intended to be investment advice.

Recommended content


Recommended content

Editors’ Picks

EUR/USD retreats to 1.0700 area following post-PCE jump

EUR/USD retreats to 1.0700 area following post-PCE jump

After spiking to a daily high of 1.0720 with the immediate reaction to US PCE inflation data, EUR/USD lost its traction and declined to the 1.0700 area. Investors remain cautious ahead of this weekend's French election and make it difficult for the Euro to gather strength.

EUR/USD News

GBP/USD stays below 1.2650 after US inflation data

GBP/USD stays below 1.2650 after US inflation data

GBP/USD struggles to preserve its bullish momentum and trades below 1.2650 in the American session on Friday. Earlier in the day, the data from the US showed that the annual core PCE inflation declined to 2.6% in May, limiting the USD's upside and helping the pair hold its ground.

GBP/USD News

Gold keeps its daily gains near $2,330 following US PCE data

Gold keeps its daily gains near $2,330 following US PCE data

Gold prices maintain their constructive bias around $2,330 after US inflation readings gauged by the PCE matched consensus in May and US yields advance slightly across the curve.

Gold News

BTC struggles around the $62,000 level

BTC struggles around the $62,000 level

Bitcoin price faces pullback resistance at the lower band of the descending wedge around $62,000. Ethereum price finds support at $3,288, the 61.8% Fibonacci retracement level. Ripple price faces resistance at $0.500, its daily resistance level.

Read more

French Elections Preview: Euro to suffer after the calm, as specter of extremists, uncertainty rise Premium

French Elections Preview: Euro to suffer after the calm, as specter of extremists, uncertainty rise

The first round of French parliamentary elections is set to trigger high uncertainty. Soothing messages from the far right and far left leave the Euro vulnerable to falls. Calm may return only after the second round of voting on  July 7.

Read more

Forex MAJORS

Cryptocurrencies

Signatures