USD/CAD Price Analysis: Confidently established above 1.3600 as oil prices nosedive, Fed policy in focus
- USD/CAD has turned sideways after a perpendicular rally inspired by weaker oil prices.
- The USD Index has dropped sharply to near 101.75 as investors are anticipating neutral guidance from the Fed.
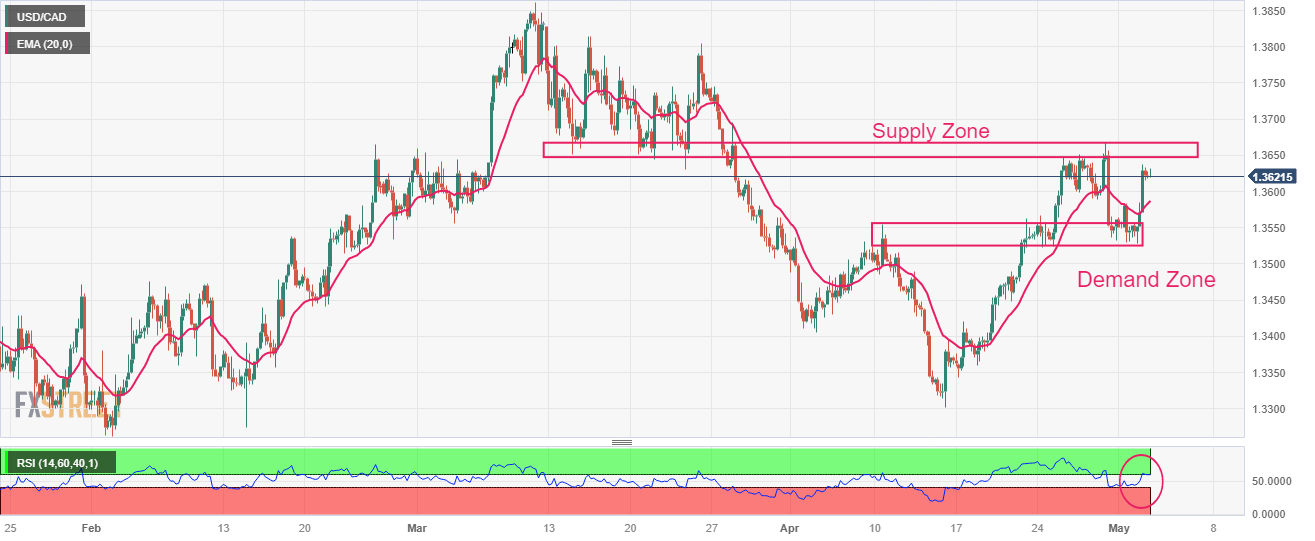
- USD/CAD is approaching the critical supply zone plotted in a range of 1.3648-1.3667.

The USD/CAD pair is displaying a sideways performance around 1.3620 in the Tokyo session. The Loonie asset displayed a perpendicular rally after defending the crucial support of 1.3540 as oil prices nosedived amid deepening fears of a recession in the United States.
The oil price has refreshed its monthly low at $71.50 and is prone to the further downside as more central banks are preparing for a fresh interest rate hike to curb sticky inflation. It is worth noting that Canada is the leading exporter of oil to the US and lower oil prices are impacting the Canadian Dollar.
Meanwhile, the US Dollar Index (DXY) has dropped sharply to near 101.75 as investors are anticipating neutral guidance from the Federal Reserve (Fed). Also, expectations of an increase in the US debt ceiling are weighing on the USD Index as it will hurt the long-term outlook of the US economy.
After sensing a steel buying interest near the demand zone placed in a narrow range of 1.3525-1.3556, USD/CAD is approaching the critical supply zone plotted in a range of 1.3648-1.3667. The Loonie asset has shifted its auction above the 20-period Exponential Moving Average (EMA) at 1.3588, which indicates that the short-term trend is bullish.
The Relative Strength Index (RSI) (14) has rebounded after sensing support near 40.00 and is making efforts in climbing above 60.00, which will result in an activation of the bullish momentum.
Should the asset break above April 28 high at 1.3668, US Dollar bulls will drive the major toward the round-level resistance at 1.3700. A break above the same will expose the asset to March 22 high at 1.3745.
On the flip side, a downside move below May 02 low at 1.3529 will expose the asset to the psychological support at 1.3500 followed by February 21 low at 1.3441.
USD/CAD four-hour chart
Author

Sagar Dua
FXStreet
Sagar Dua is associated with the financial markets from his college days. Along with pursuing post-graduation in Commerce in 2014, he started his markets training with chart analysis.


