|

USD/CAD Price Analysis: Buyers need validation from 1.3500 to retake control

  • USD/CAD grinds higher while paring the biggest daily fall in a fortnight.
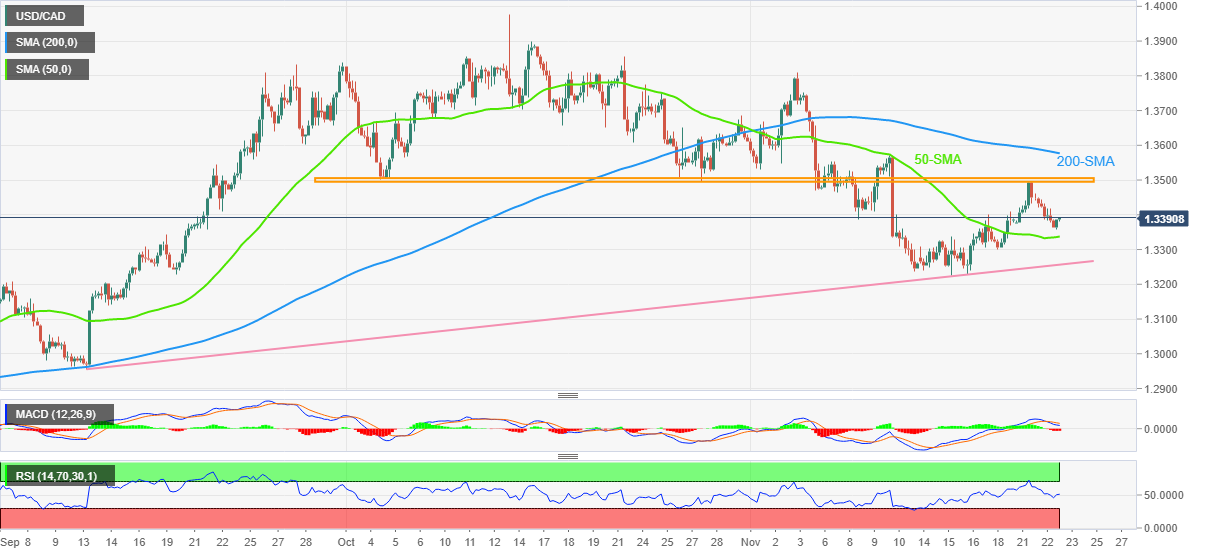
  • 50-SMA, ascending trend line from early September restrict immediate downside.
  • Seven-week-old horizontal support area challenge buyers before 200-SMA.
  • Bearish MACD signals, steady RSI favor short-term sellers.

USD/CAD seesaws around the intraday high of 1.3391 as bulls struggle to retake control heading into Wednesday’s European session. That said, the Canadian Dollar (CAD) pair reversed from the 1.5-month-old horizontal resistance the previous day while posting the biggest daily loss in two weeks.

However, the quote’s sustained trading beyond the 50-SMA and an upward-sloping support line from September 13, respectively near 1.3340 and 1.3255, seem to keep the USD/CAD buyers hopeful.

Even so, the bearish steady prints of the Relative Strength Index (RSI), placed at 14, join the bearish signals from the Moving Average Convergence and Divergence (MACD) indicator, to suggest that the quote has limited upside momentum.

As a result, the latest recovery may aim for the aforementioned resistance line surrounding the 1.3500 hurdle. However, any further upside will need validation from the 200-SMA level of 1.3580 to convince the USD/CAD buyers.

In a case where the Loonie pair stays firmer past 1.3580, the odds of witnessing a run-up toward the monthly high near 1.3810 can’t be ruled out.

On the contrary, a downside break of the 50-SMA and aforementioned short-term support line, close to 1.3340 and 1.3255 in that order, could challenge the USD/CAD pair’s fresh declines.

Following that, the monthly low of 1.3226 could act as the last defense of the pair buyers.

USD/CAD: Four-hour chart

Trend: Limited recovery expected

Additional important levels

Overview
Today last price1.3389
Today Daily Change0.0016
Today Daily Change %0.12%
Today daily open1.3373
 
Trends
Daily SMA201.3471
Daily SMA501.356
Daily SMA1001.326
Daily SMA2001.3001
 
Levels
Previous Daily High1.346
Previous Daily Low1.3373
Previous Weekly High1.3409
Previous Weekly Low1.3226
Previous Monthly High1.3978
Previous Monthly Low1.3496
Daily Fibonacci 38.2%1.3406
Daily Fibonacci 61.8%1.3427
Daily Pivot Point S11.3344
Daily Pivot Point S21.3315
Daily Pivot Point S31.3257
Daily Pivot Point R11.3431
Daily Pivot Point R21.3489
Daily Pivot Point R31.3518

Author

Anil Panchal

Anil Panchal

FXStreet

Anil Panchal has nearly 15 years of experience in tracking financial markets. With a keen interest in macroeconomics, Anil aptly tracks global news/updates and stays well-informed about the global financial moves and their implications.

More from Anil Panchal
Share:

Markets move fast. We move first.

Orange Juice Newsletter brings you expert driven insights - not headlines. Every day on your inbox.

By subscribing you agree to our Terms and conditions.

Editor's Picks

EUR/USD clings to small gains near 1.1750

Following a short-lasting correction in the early European session, EUR/USD regains its traction and clings to moderate gains at around 1.1750 on Monday. Nevertheless, the pair's volatility remains low, with investors awaiting this weeks key US data releases and the ECB policy announcements.

GBP/USD edges higher toward 1.3400 as traders await key data and BoE

GBP/USD reverses its direction and advances toward 1.3400 following a drop to the 1.3350 area earlier in the day. The US Dollar struggles to gather recovery momentum as markets await Tuesday's Nonfarm Payrolls data, while the Pound Sterling holds steady ahead of the BoE policy announcements later in the week.

Gold builds on previous week's gains, approaches $4,350

Gold preserves its bullish momentum after rising more than 2% last week and climbs toward $4,350 on Monday. The precious metal extends its upside as the US Dollar remains on the back foot on growing expectations for a dovish Fed policy outlook next year.

Solana consolidates as spot ETF inflows near $1 billion signal institutional dip-buying

Solana price hovers above $131 at the time of writing on Monday, nearing the upper boundary of a falling wedge pattern, awaiting a decisive breakout. On the institutional side, demand for spot Solana Exchange-Traded Funds remained firm, pushing total assets under management to nearly $1 billion since launch. 

Big week ends with big doubts

The S&P 500 continued to push higher yesterday as the US 2-year yield wavered around the 3.50% mark following a Federal Reserve (Fed) rate cut earlier this week that was ultimately perceived as not that hawkish after all. The cut is especially boosting the non-tech pockets of the market.

Solana Price Forecast: SOL consolidates as spot ETF inflows near $1 billion signal institutional dip-buying

Solana (SOL) price hovers above $131 at the time of writing on Monday, nearing the upper boundary of a falling wedge pattern, awaiting a decisive breakout.