USD/CAD Price Analysis: Bulls step on the gas in Tokyo open
- USD/CAD bulls moving in as the price corrects in an M-formation on H4 charts.
- Bulls eye a move towards the 1.30 figure for the day ahead.

For the Tokyo open, we are seeing a break of resistance 1.2960 that could open the way to a bullish extension below 1.2965, 1.2970 and to 1.2980:
USD/CAD M15 chart
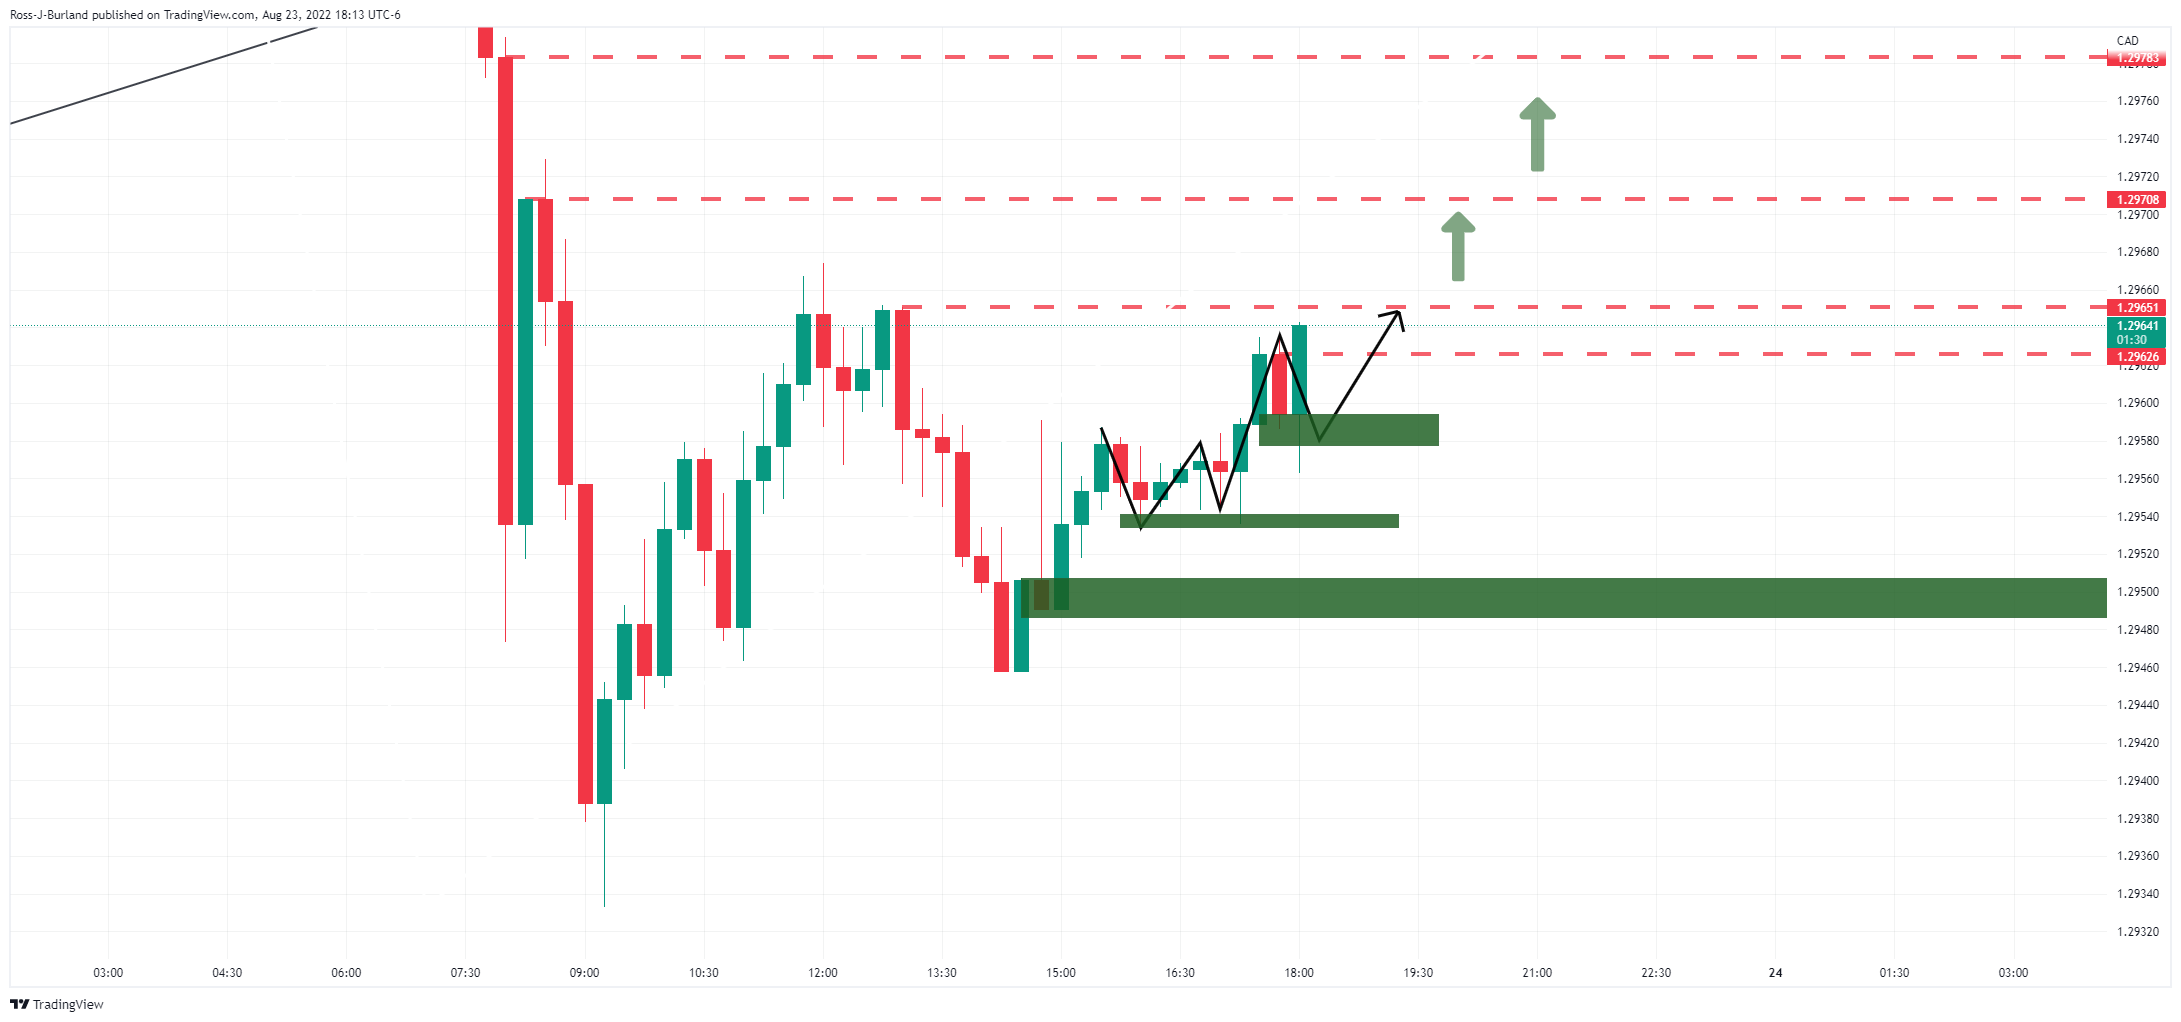
On the back of the W-formation breakout, and given that the price has been marking out its support base on the structure of the 15-min chart, if the bulls continue to close above the said levels, the 1.30s will be back in vogue:
USD/CAD prior analysis, H4 chart
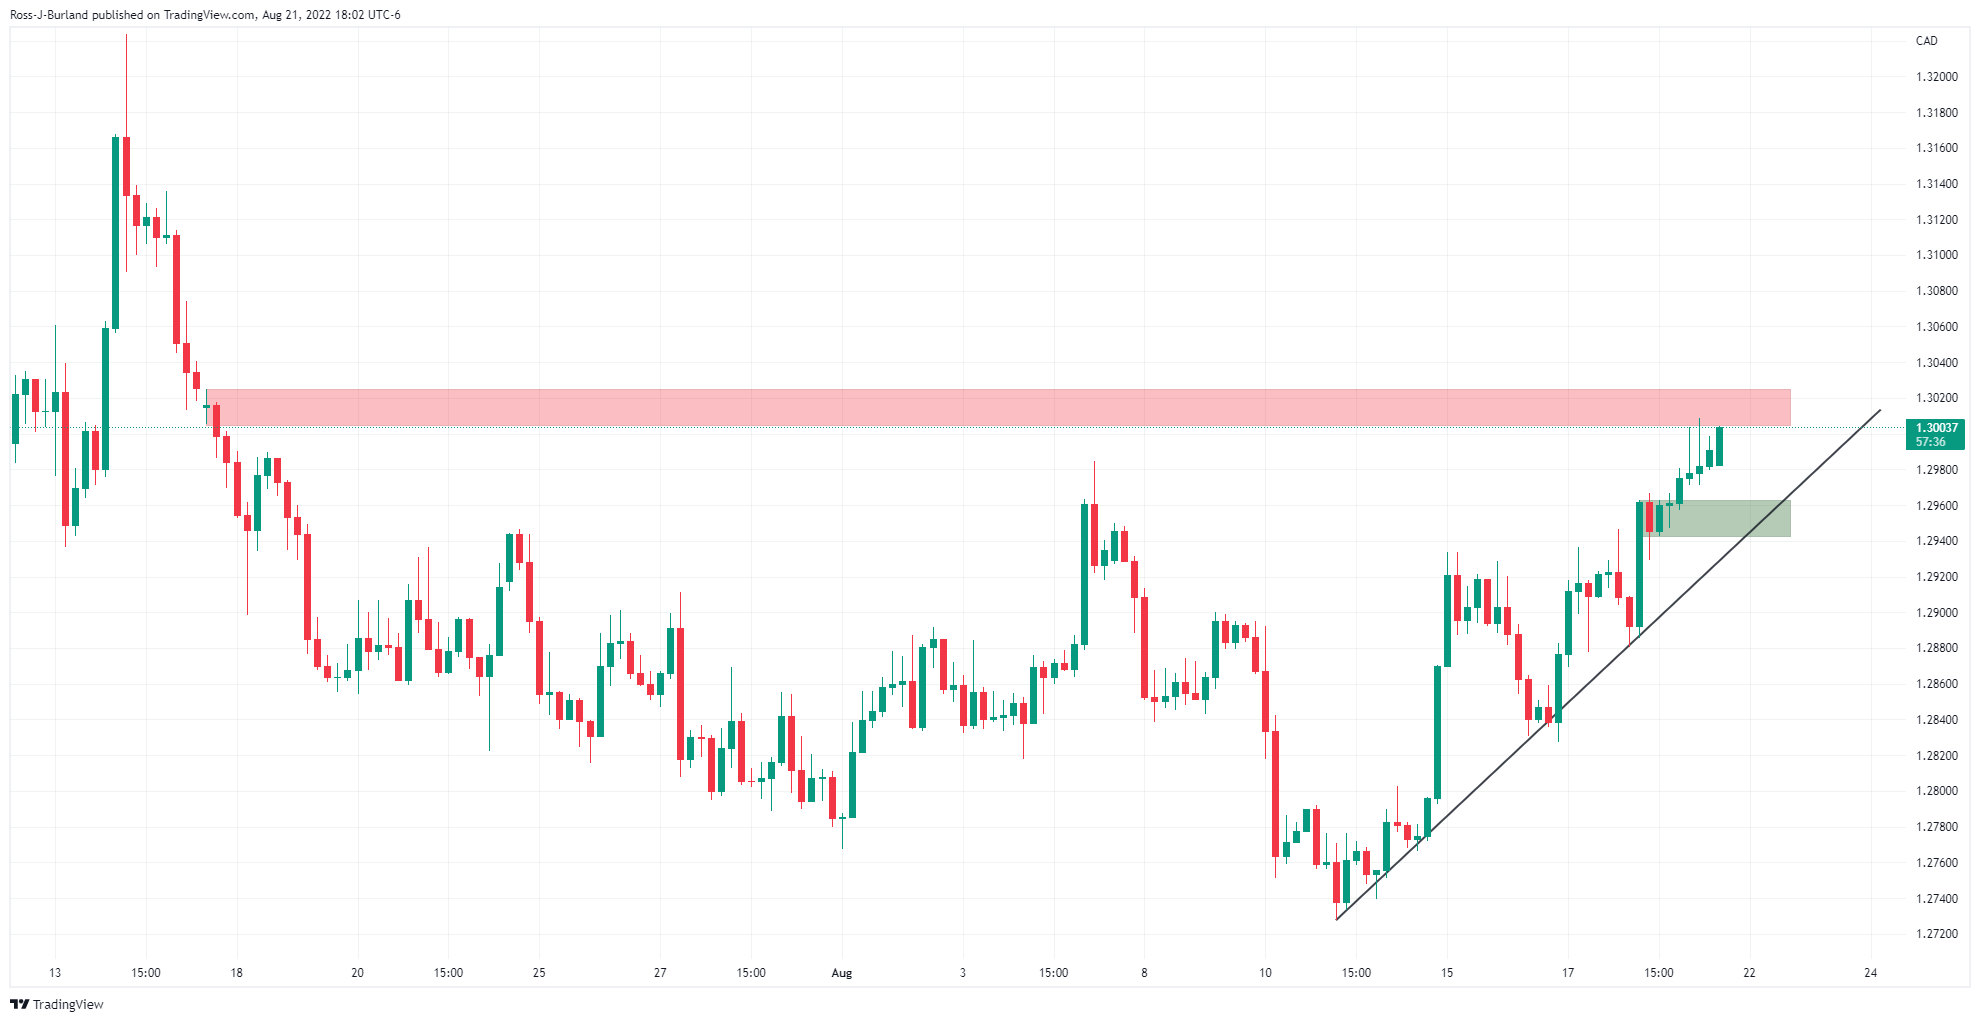
It was stated in the prior analysis that the price had been rising along the trendline but had moved away which could result in a correction as the price meets a resistance zone:
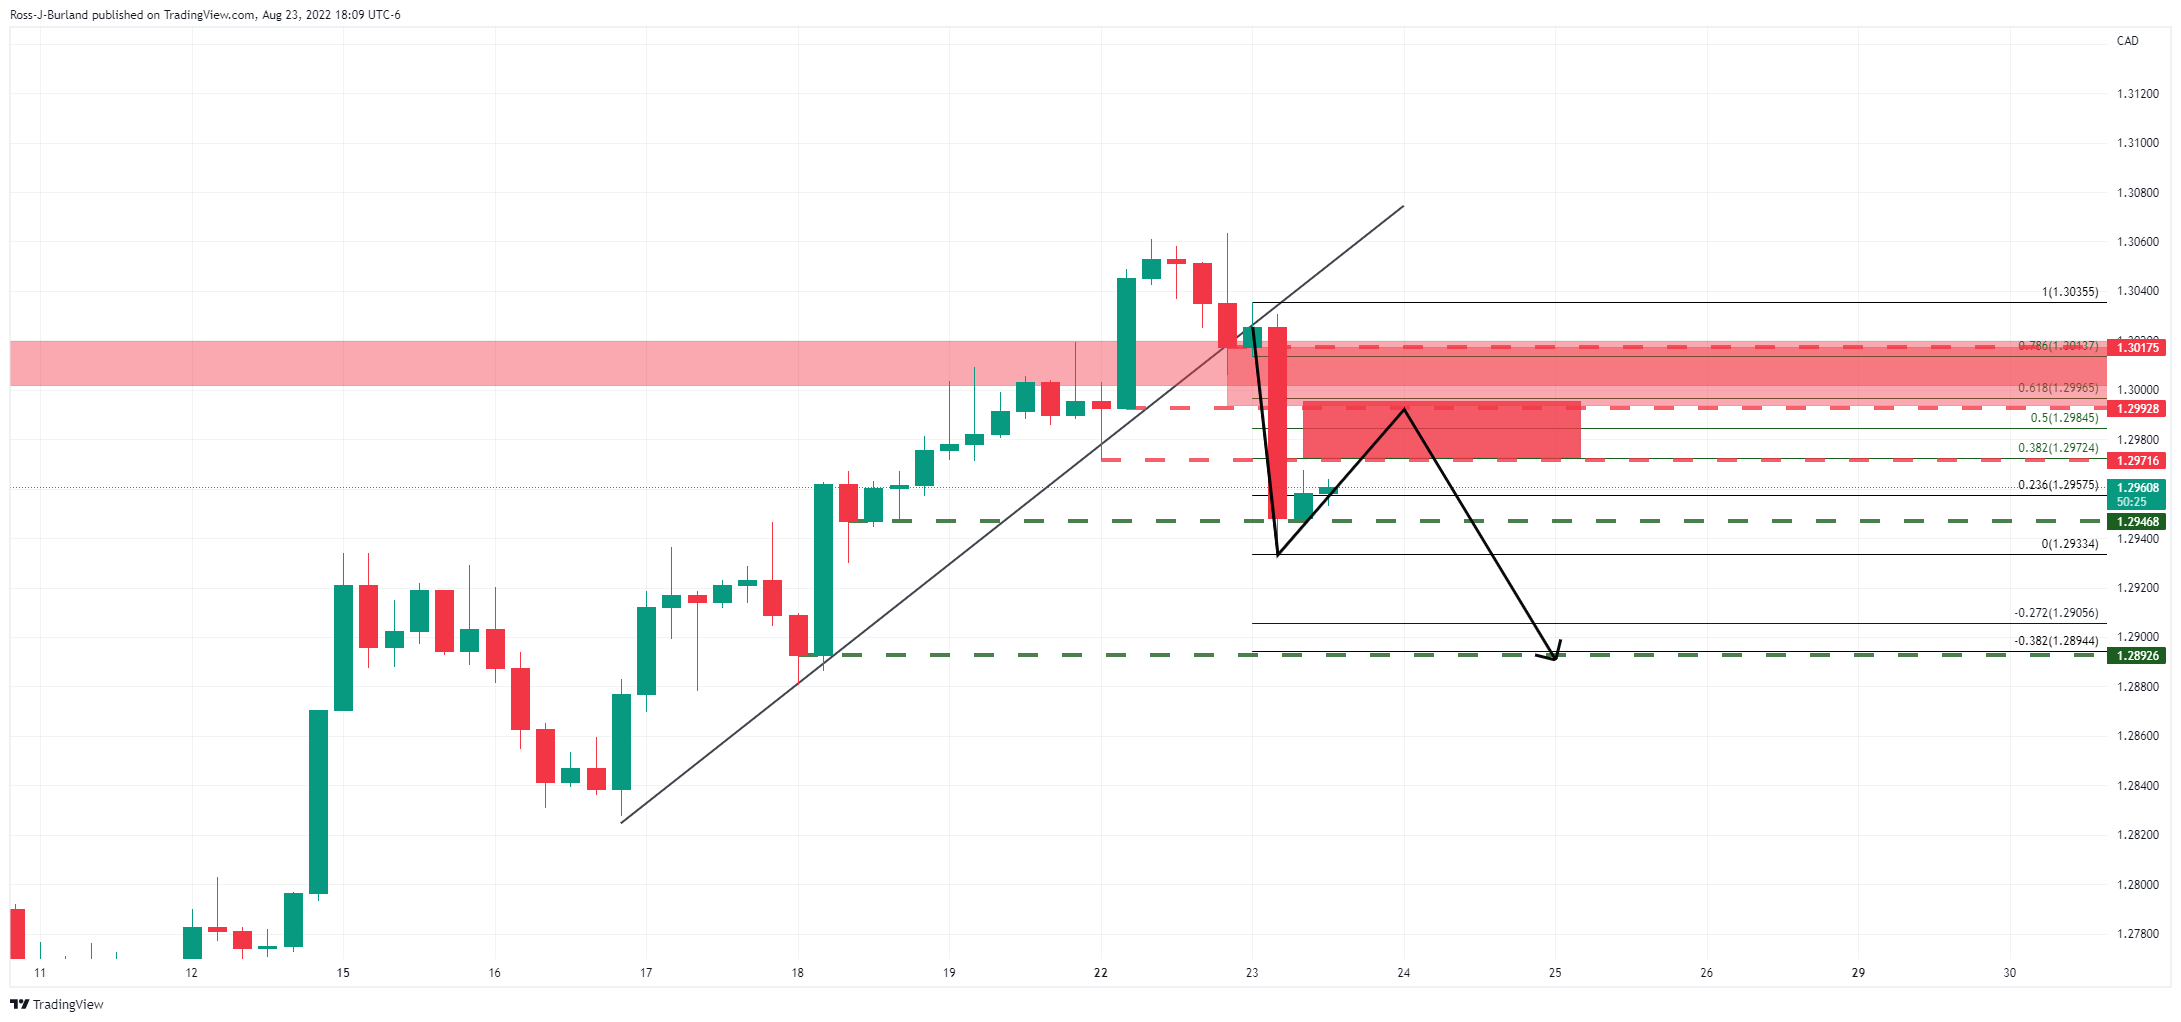
USD/CAD live H4 chart
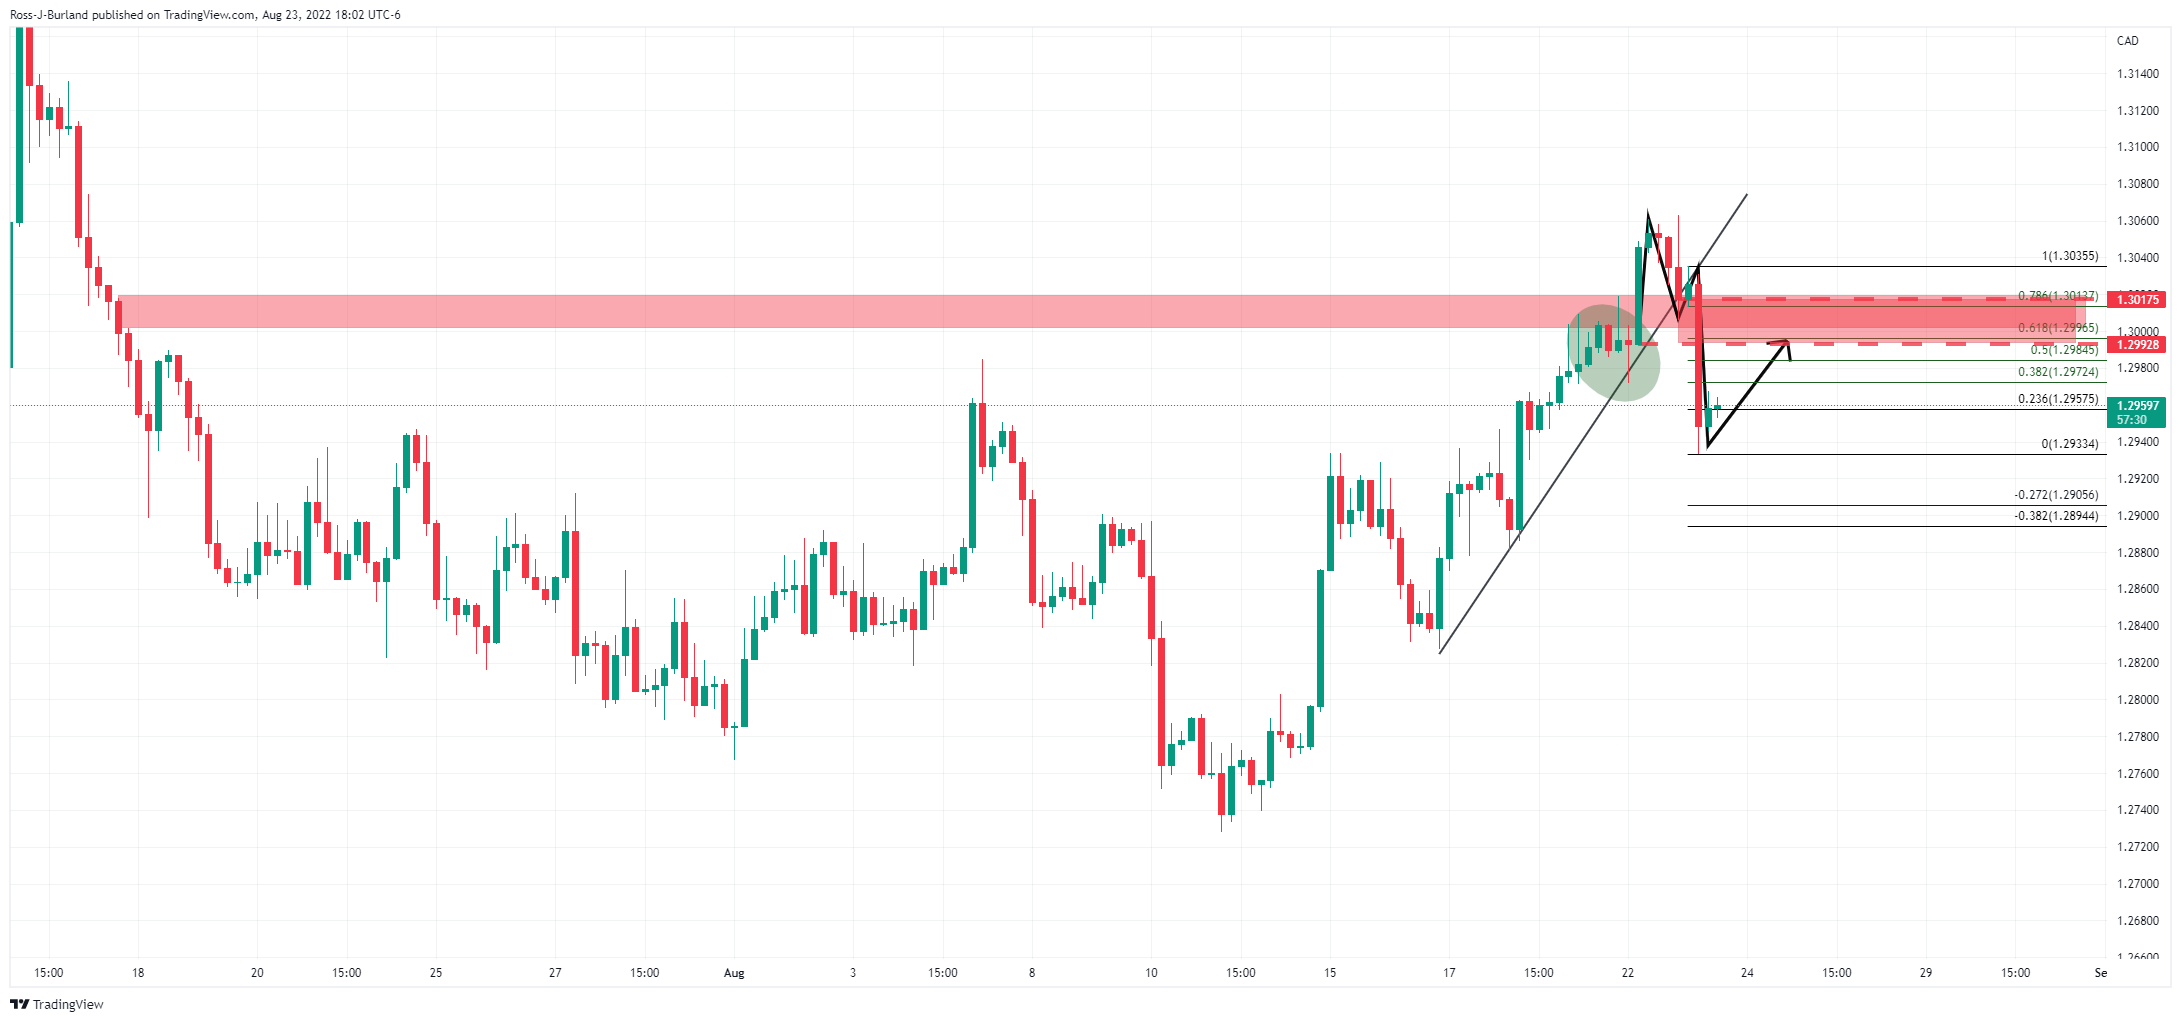
As illustrated, the price moved into the support line, popped the resistance and has since pulled below the trendline which would now be expected to act as a counter-trendline for the sessions ahead. The price has left a bullish reversion pattern on the charts also. This is pulling the price into the Fibonacci scale with 1.2970/90 an area that could be exploited by the bulls in the day ahead. Thereafter, the neckline of the pattern guards a break above 1.3020. On the downside, the bears could be encouraged on a break below 1.2950 support:
Author

Ross J Burland
FXStreet
Ross J Burland, born in England, UK, is a sportsman at heart. He played Rugby and Judo for his county, Kent and the South East of England Rugby team.


