- The USD/CAD is ready to test a one-month-old resistance trendline at around 1.3650.
- USD/CAD Price Analysis: Upward biased, it could test the 1.3700 figure.
The USD/CAD reclaims the 1.3600 mark after dropping to a daily low of 1.3524. The pair tested the 50-day Exponential Moving Average (EMA) at 1.3532 before reversing its course and posting gains of 0.64% on Tuesday. As the Asian session begins, the USD/CAD exchanges hands at around 1.3620.
USD/CAD Price Analysis
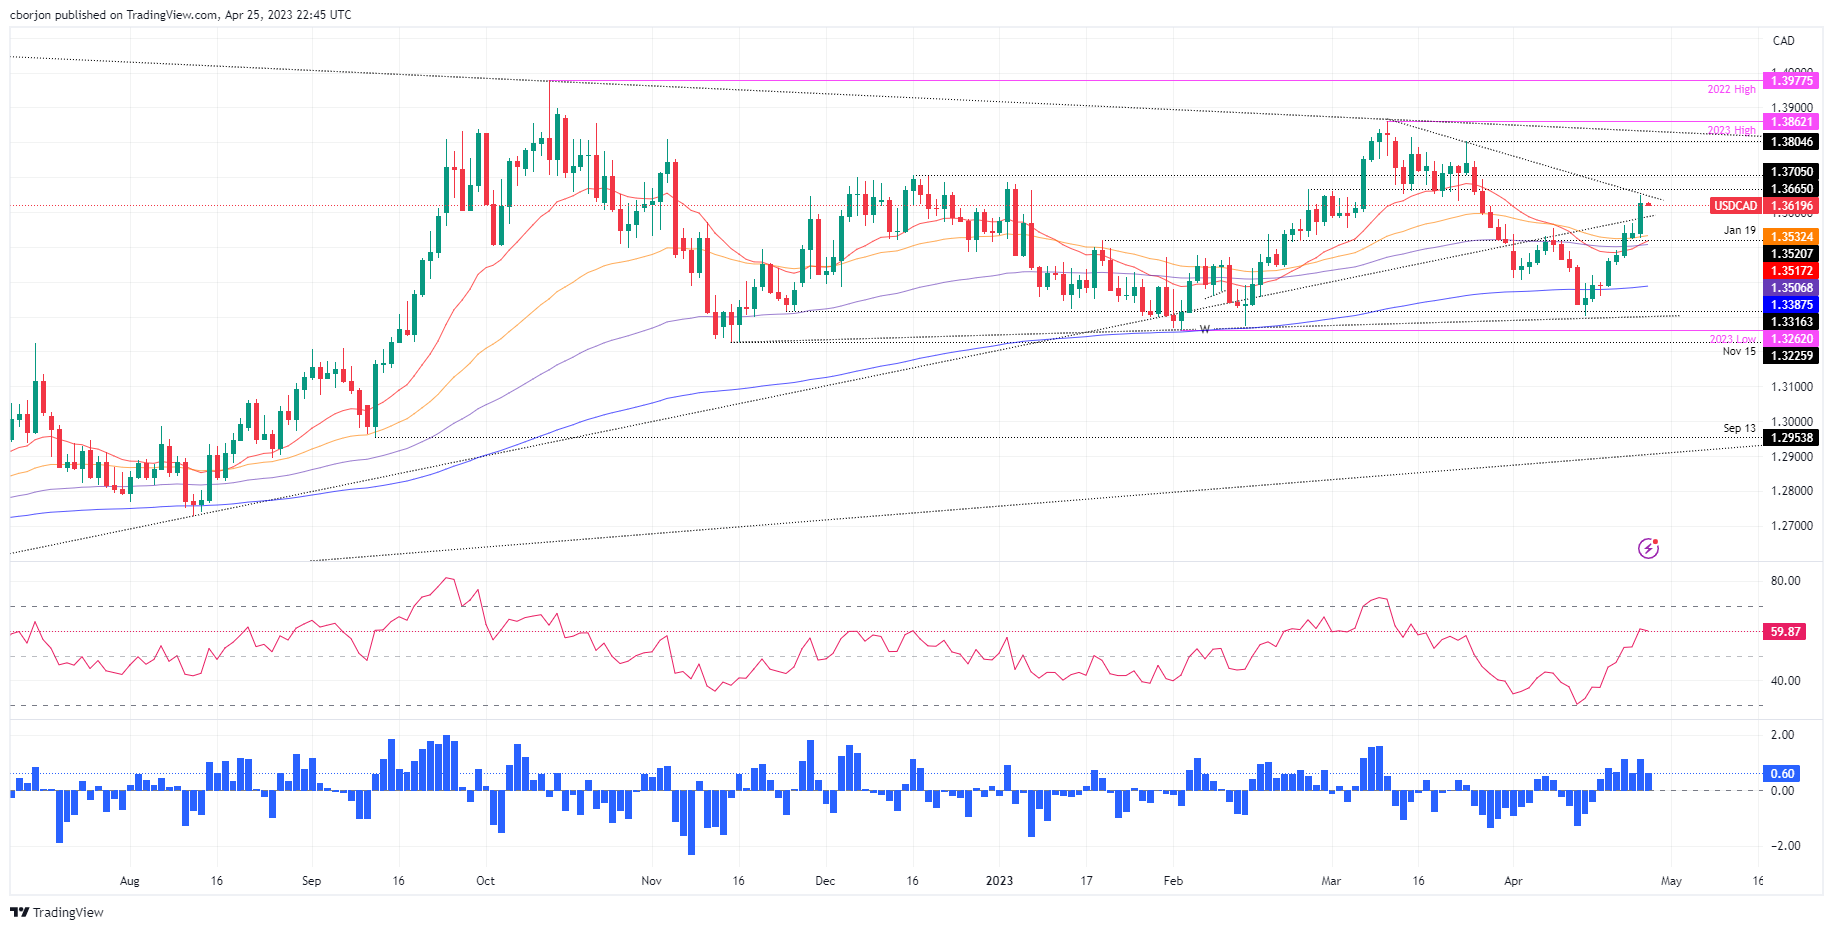
After Tuesday’s price action, the USD/CAD is poised to test a resistance trendline at around 1.3635-50, which could pave the way for further upside once broken. In addition, the Relative Strength Index (RSI), in bullish territory, aims upward, suggesting buyers are moving in. Another reason for the USD/CAD to continue its uptrend is the Rate of Change (RoC), indicating that buying pressure increased in the last three days.
That said, the USD/CAD first resistance would be 1.3650. Once cleared, the USD/CAD next resistance would be 1.3700, followed by the March 24 cycle high at 1.3804 and the YTD high at 1.3862.
Conversely, the USD/CAD could shift downwards if it fails to crack the one-month-old resistance trendline. Hence, the USD/CAD first support would be the psychological 1.3600 figure. The seller’s next stop would be the 50-day EMA at 1.3532 before testing the 20-day EMA at 1.3517, followed by the 100-day EMA at 1.3506.
USD/CAD Daily Chart
USD/CAD
Overview
Today last price1.362
Today Daily Change0.0080
Today Daily Change %0.59
Today daily open1.354
Trends
Daily SMA201.3474
Daily SMA501.3571
Daily SMA1001.3529
Daily SMA2001.3414
Levels
Previous Daily High1.3567
Previous Daily Low1.3523
Previous Weekly High1.3563
Previous Weekly Low1.3343
Previous Monthly High1.3862
Previous Monthly Low1.3508
Daily Fibonacci 38.2%1.355
Daily Fibonacci 61.8%1.354
Daily Pivot Point S11.352
Daily Pivot Point S21.3499
Daily Pivot Point S31.3475
Daily Pivot Point R11.3564
Daily Pivot Point R21.3588
Daily Pivot Point R31.3609
Information on these pages contains forward-looking statements that involve risks and uncertainties. Markets and instruments profiled on this page are for informational purposes only and should not in any way come across as a recommendation to buy or sell in these assets. You should do your own thorough research before making any investment decisions. FXStreet does not in any way guarantee that this information is free from mistakes, errors, or material misstatements. It also does not guarantee that this information is of a timely nature. Investing in Open Markets involves a great deal of risk, including the loss of all or a portion of your investment, as well as emotional distress. All risks, losses and costs associated with investing, including total loss of principal, are your responsibility. The views and opinions expressed in this article are those of the authors and do not necessarily reflect the official policy or position of FXStreet nor its advertisers. The author will not be held responsible for information that is found at the end of links posted on this page.
If not otherwise explicitly mentioned in the body of the article, at the time of writing, the author has no position in any stock mentioned in this article and no business relationship with any company mentioned. The author has not received compensation for writing this article, other than from FXStreet.
FXStreet and the author do not provide personalized recommendations. The author makes no representations as to the accuracy, completeness, or suitability of this information. FXStreet and the author will not be liable for any errors, omissions or any losses, injuries or damages arising from this information and its display or use. Errors and omissions excepted.
The author and FXStreet are not registered investment advisors and nothing in this article is intended to be investment advice.
Recommended content
Editors’ Picks

EUR/USD flat lines above mid-1.0900s, investors seem non-committed amid rising trade tensions
The EUR/USD pair reverses an Asian session dip to the 1.0880 area and for now, seems to have stalled its retracement slide from the vicinity of mid-1.1100s, or the highest level since September touched last week. Spot prices currently trade around the 1.0960 region, nearly unchanged for the day amid mixed cues.

GBP/USD bounces off one-month low, defends 200-day SMA and retakes 1.2900
The GBP/USD pair attracts some dip-buyers near the 1.2830 region, or over a one-month low touched during the Asian session on Monday and for now, seems to have stalled its retracement slide from a six-month peak touched last week.

Gold price rebounds swiftly from multi-week low; lacks follow-through
Gold price reverses an Asian session slide to over a three-week low, though it lacks follow-through. Recession fears continue to weigh on investor sentiment and benefit the safe-haven commodity. Bets for more aggressive Fed rate cuts undermine USD and also lend support to the XAU/USD pair.

Bitcoin, Ethereum and Ripple head to yearly lows while ETH hits two-year bottom
Bitcoin price hovers around $78,600 on Monday after falling nearly 5% the previous week. Ethereum and Ripple also followed in BTC’s footsteps and declined 13% and 10%, respectively, in the previous week.

Strategic implications of “Liberation Day”
Liberation Day in the United States came with extremely protectionist and inward-looking tariff policy aimed at just about all U.S. trading partners. In this report, we outline some of the more strategic implications of Liberation Day and developments we will be paying close attention to going forward.

The Best brokers to trade EUR/USD
SPONSORED Discover the top brokers for trading EUR/USD in 2025. Our list features brokers with competitive spreads, fast execution, and powerful platforms. Whether you're a beginner or an expert, find the right partner to navigate the dynamic Forex market.