|

USD/CAD Price Analysis: Bears need validation from 1.3500 support confluence

  • USD/CAD holds lower ground near intraday low, snaps two-day uptrend.
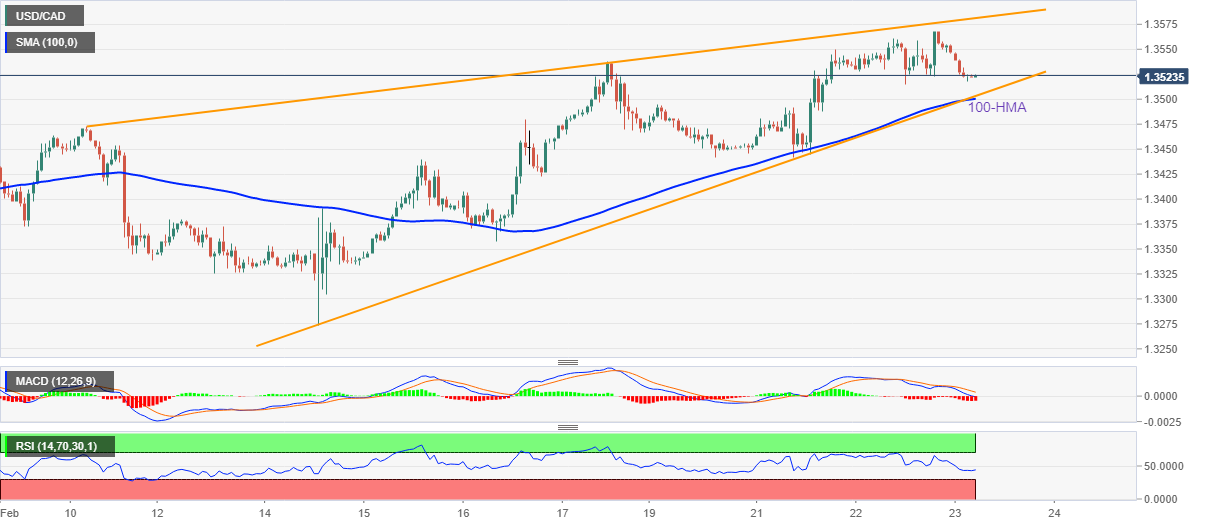
  • Bearish MACD signals, downbeat RSI hints at further downside of the Loonie pair.
  • Convergence of 100-HMA, support line of two-week-old ascending triangle restricts short-term declines of the USD/CAD pair.

USD/CAD drops 0.25% intraday during the first loss-making day in three heading into Thursday’s European session. In doing so, the Loonie pair drops to 1.3520 by the press time.

That said, the USD/CAD pair’s latest moves appear forming a fortnight-old ascending triangle formation. The same joins downbeat RSI (14) and bearish MACD signals to favor the bearish chart formation.

However, a clear downside break of 1.3500 becomes necessary as the 100-Hour Moving Average (HMA) joins the stated triangle’s lower line to increase the strength of the stated support confluence.

Following that, tops marked during late January and early February, respectively near 1.3520 and 1.3475, could probe the USD/CAD bears before directing them to the theoretical target surrounding 1.3200.

On the contrary, USD/CAD buyers may aim for the latest swing high surrounding 1.3570 before poking the stated triangle’s top line, close to 1.3585 by the press time.

In a case where the Loonie pair remains firmer past 1.3585, the bearish chart formation gets defied as the bulls brace for a late 2022 swing high surrounding 1.3700.

To sum up, USD/CAD slips off bull’s radar but the sellers await clear break of 1.3500 to retake control.

USD/CAD: Hourly chart

Trend: Limited downside expected

Additional important levels

Overview
Today last price1.3522
Today Daily Change-0.0034
Today Daily Change %-0.25%
Today daily open1.3556
 
Trends
Daily SMA201.3399
Daily SMA501.3466
Daily SMA1001.3515
Daily SMA2001.3256
 
Levels
Previous Daily High1.3568
Previous Daily Low1.3515
Previous Weekly High1.3538
Previous Weekly Low1.3274
Previous Monthly High1.3685
Previous Monthly Low1.33
Daily Fibonacci 38.2%1.3548
Daily Fibonacci 61.8%1.3535
Daily Pivot Point S11.3524
Daily Pivot Point S21.3493
Daily Pivot Point S31.3471
Daily Pivot Point R11.3578
Daily Pivot Point R21.36
Daily Pivot Point R31.3632

Author

Anil Panchal

Anil Panchal

FXStreet

Anil Panchal has nearly 15 years of experience in tracking financial markets. With a keen interest in macroeconomics, Anil aptly tracks global news/updates and stays well-informed about the global financial moves and their implications.

More from Anil Panchal
Share:

Markets move fast. We move first.

Orange Juice Newsletter brings you expert driven insights - not headlines. Every day on your inbox.

By subscribing you agree to our Terms and conditions.

Editor's Picks

EUR/USD clings to small gains near 1.1750

Following a short-lasting correction in the early European session, EUR/USD regains its traction and clings to moderate gains at around 1.1750 on Monday. Nevertheless, the pair's volatility remains low, with investors awaiting this weeks key US data releases and the ECB policy announcements.

GBP/USD edges higher toward 1.3400 as traders await key data and BoE

GBP/USD reverses its direction and advances toward 1.3400 following a drop to the 1.3350 area earlier in the day. The US Dollar struggles to gather recovery momentum as markets await Tuesday's Nonfarm Payrolls data, while the Pound Sterling holds steady ahead of the BoE policy announcements later in the week.

Gold builds on previous week's gains, approaches $4,350

Gold preserves its bullish momentum after rising more than 2% last week and climbs toward $4,350 on Monday. The precious metal extends its upside as the US Dollar remains on the back foot on growing expectations for a dovish Fed policy outlook next year.

Solana consolidates as spot ETF inflows near $1 billion signal institutional dip-buying

Solana price hovers above $131 at the time of writing on Monday, nearing the upper boundary of a falling wedge pattern, awaiting a decisive breakout. On the institutional side, demand for spot Solana Exchange-Traded Funds remained firm, pushing total assets under management to nearly $1 billion since launch. 

Big week ends with big doubts

The S&P 500 continued to push higher yesterday as the US 2-year yield wavered around the 3.50% mark following a Federal Reserve (Fed) rate cut earlier this week that was ultimately perceived as not that hawkish after all. The cut is especially boosting the non-tech pockets of the market.

Solana Price Forecast: SOL consolidates as spot ETF inflows near $1 billion signal institutional dip-buying

Solana (SOL) price hovers above $131 at the time of writing on Monday, nearing the upper boundary of a falling wedge pattern, awaiting a decisive breakout.