- USD/CAD falls amidst broad US Dollar weakness across the board.
- The SVB crisis in the United States sent ripples in the financial markets, with UST bond yields plummeting.
- USD/CAD Price Analysis: In the near term, neutral to downward biased.
USD/CAD drops from around daily highs of 1.3815, falls 0.90% on overall US Dollar (USD) weakness, spurred on an ongoing Regional Bank crisis in the US. Therefore, UST bond yields plunge; consequently, the buck is down. At the time of writing, the USD/CAD is trading at 1.3692.
USD/CAD Price Action
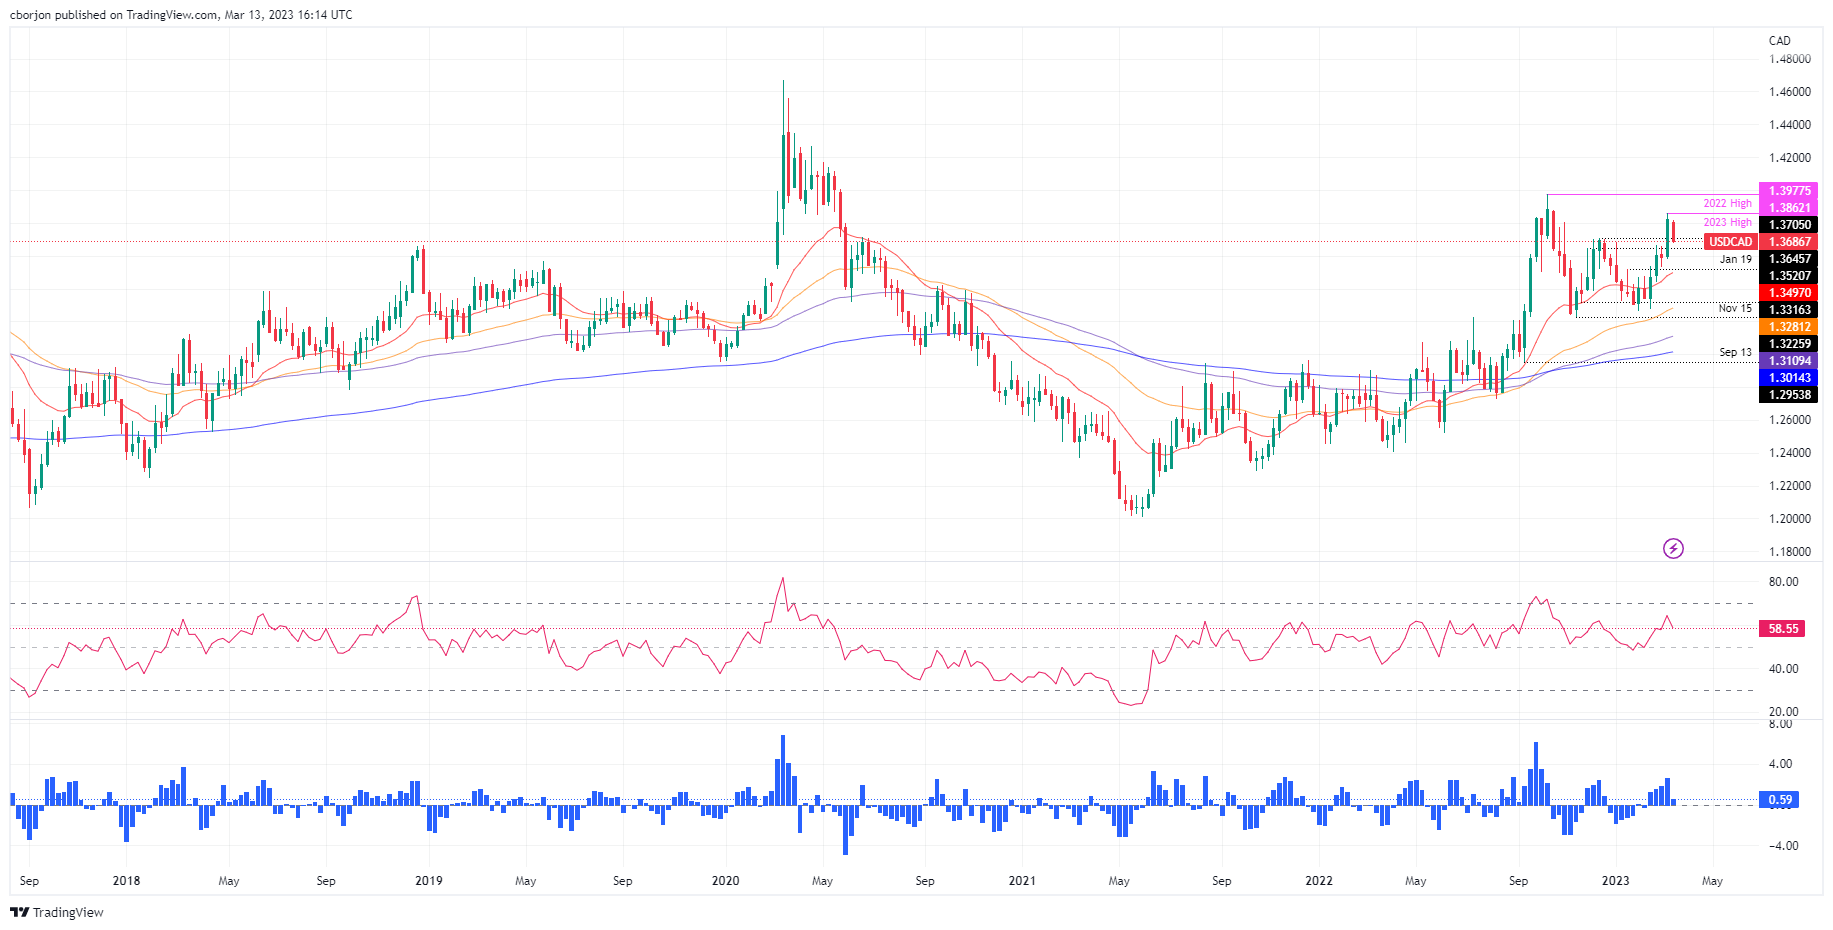
After rallying to YTD highs of 1.3862, the Canadian dollar (CAD) is recovering some ground, eyeing a daily close below the December 12 high at 1.3705. Even though the financial markets are punishing the US Dollar (USD), safe-haven flows would increase volatility in USD-denominated currency pairs. If the banking crisis ease, traders should expect a repricing of the Fed, meaning further upside in the USD/CAD is expected.
In the short term, the USD/CAD might fall toward 1.3600, but solid support areas would face it. The first support would be the February 20 daily high at 1.3665, followed by the 1.3600 figure. A breach of the latter will expose the 20-day Exponential Moving Average (EMA) at 1.3496 before testing the 50-day EMA at 1.3280.
In an alternate scenario, the USD/CAD first resistance would be 1.3700. Once cleared, the pair could rally towards the 1.3800 area, ahead of testing the YTD high at 1.3862.
Oscillators like the Relative Strength Index (RSI) at 58.22 aiming lower suggests that sellers are gathering momentum. The Rate of Change (RoC), shifted toward neutral territory, displaying that buying pressure is waning.
Trend: In the near term, neutral to downwards.
USD/CAD Daily Chart
USD/CAD Technical Levels
Information on these pages contains forward-looking statements that involve risks and uncertainties. Markets and instruments profiled on this page are for informational purposes only and should not in any way come across as a recommendation to buy or sell in these assets. You should do your own thorough research before making any investment decisions. FXStreet does not in any way guarantee that this information is free from mistakes, errors, or material misstatements. It also does not guarantee that this information is of a timely nature. Investing in Open Markets involves a great deal of risk, including the loss of all or a portion of your investment, as well as emotional distress. All risks, losses and costs associated with investing, including total loss of principal, are your responsibility. The views and opinions expressed in this article are those of the authors and do not necessarily reflect the official policy or position of FXStreet nor its advertisers. The author will not be held responsible for information that is found at the end of links posted on this page.
If not otherwise explicitly mentioned in the body of the article, at the time of writing, the author has no position in any stock mentioned in this article and no business relationship with any company mentioned. The author has not received compensation for writing this article, other than from FXStreet.
FXStreet and the author do not provide personalized recommendations. The author makes no representations as to the accuracy, completeness, or suitability of this information. FXStreet and the author will not be liable for any errors, omissions or any losses, injuries or damages arising from this information and its display or use. Errors and omissions excepted.
The author and FXStreet are not registered investment advisors and nothing in this article is intended to be investment advice.
Recommended content
Editors’ Picks

EUR/USD falls to fresh daily lows below 1.0400 after upbeat US data
EUR/USD came under selling pressure early in the American session following the release of United States macroeconomic figures. The December ISM Services PMI unexpectedly surged to 54.1, while November JOLTS Job Openings rose to 8.1 million, also bearing expectations.

GBP/USD extends retracement, struggles to retain 1.2500
GBP/USD lost further traction and battles to retain the 1.2500 mark after hitting an intraday high of 1.2575. Stock markets turned south after the release of upbeat American data, providing fresh legs to the US Dollar rally.

Gold holds on to modest gains amid a souring mood
Spot Gold lost its bullish traction and retreated toward the $2,650 area following the release of encouraging US macroeconomic figures. Jumping US Treasury yields further support the US Dollar in the near term.

Bitcoin Price Forecast: BTC holds above $100K following Fed’s Michael Barr resign
Bitcoin edges slightly down to around $101,300 on Tuesday after rallying almost 4% the previous day. The announcement of Michael S. Barr’s resignation as Federal Reserve Vice Chair for Supervision on Monday has pushed BTC above the $100K mark.

Five fundamentals for the week: Nonfarm Payrolls to keep traders on edge in first full week of 2025 Premium
Did the US economy enjoy a strong finish to 2024? That is the question in the first full week of trading in 2025. The all-important NFP stand out, but a look at the Federal Reserve and the Chinese economy is also of interest.

Best Forex Brokers with Low Spreads
VERIFIED Low spreads are crucial for reducing trading costs. Explore top Forex brokers offering competitive spreads and high leverage. Compare options for EUR/USD, GBP/USD, USD/JPY, and Gold.
