|

USD/CAD Price Analysis: Approaches 1.3500 amid weak oil prices, Canada Retail Sales eyed

  • USD/CAD is marching towards 1.3500 as weak oil prices have impacted the Canadian Dollar.
  • Monthly Retail Sales data (Feb) are expected to contract by 0.5% vs. an expansion of 1.4% recorded in January.
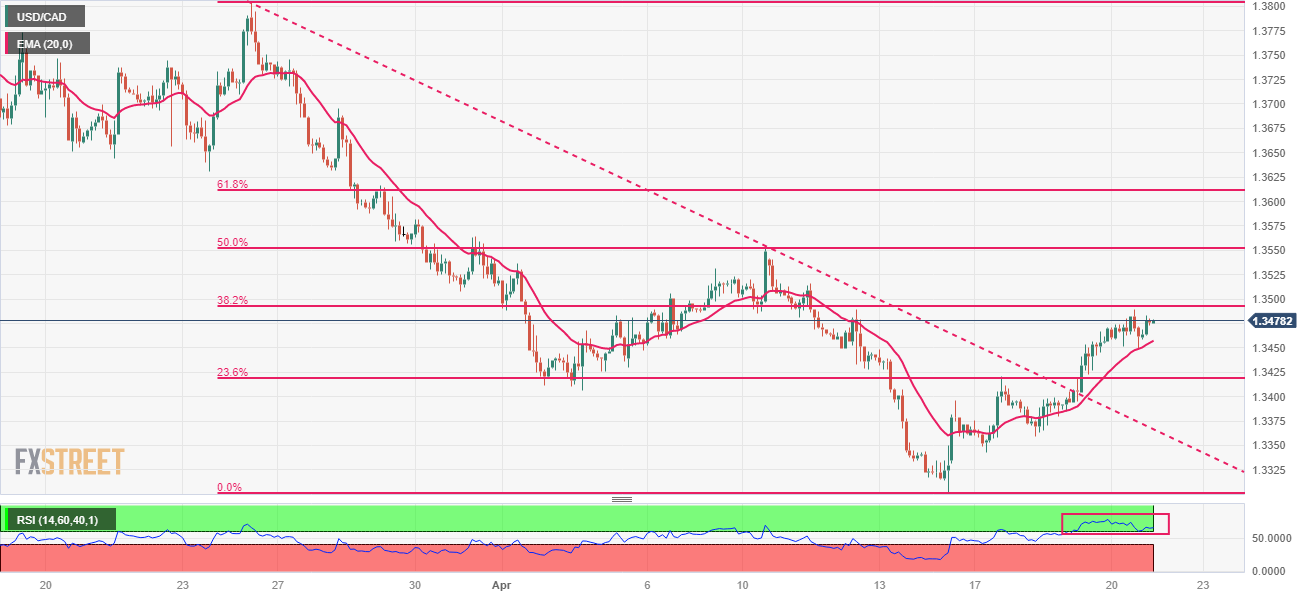
  • USD/CAD is struggling in extending its upside journey after reaching near the 38.2% Fibo retracement at 1.3493.

The USD/CAD pair is gathering strength to recapture the psychological resistance of 1.3500 in the early Tokyo session. The Loonie asset is showing enormous strength despite a corrective move in the US Dollar Index (DXY). The USD Index has corrected sharply below 101.80 after failing to recapture the critical resistance of 102.00.

Therefore, the strength in the Loonie asset is coming from the weak Canadian Dollar, which is the outcome of diving oil prices. The oil price is on the verge of slipping below the immediate support of $77.00. The downside journey in the oil price is expected to find an intermediate support of around $75.65. The black gold has surrendered the majority of gains generated after the surprise announcement of production cuts by OPEC+.

Volatility is expected from the Canadian Dollar ahead of the release of Canada’s Retail Sales data. As per the consensus, monthly Retail Sales data (Feb) are expected to contract by 0.5% vs. an expansion of 1.4% recorded in January. Weak retail demand would provide some relief to the Bank of Canada (BoC) ahead.

USD/CAD witnessed a steep rise after breaking above the downward-sloping trendline plotted from March 24 high at 1.3804 on a two-hour scale. The Loonie asset is struggling in extending its upside journey after reaching near the 38.2% Fibonacci retracement (plotted from March 24 high at 1.3804 to April 14 low at 1.3300) at 1.3493.

The 20-period Exponential Moving Average (EMA) at 1.3458 is providing support to the US Dollar.

Meanwhile, the Relative Strength Index (RSI) (14) is oscillating in the bullish range of 60.00-80.00, indicating more upside ahead.

A decisive break above 38.2% Fibo retracement at around 1.3500 will drive the asset toward the April 10 high at 1.3554. A breach of the latter will expose the asset to round-level resistance at 1.3600.

On the flip side, a break below the round-level support of 1.3300 will drag the Loonie asset toward February 01 low at 1.3267, followed by 15 November 2022 low at 1.3226.

USD/CAD two-hour chart

USD/CAD

Overview
Today last price1.3478
Today Daily Change0.0017
Today Daily Change %0.13
Today daily open1.3461
 
Trends
Daily SMA201.3502
Daily SMA501.3562
Daily SMA1001.3528
Daily SMA2001.3407
 
Levels
Previous Daily High1.3467
Previous Daily Low1.338
Previous Weekly High1.3554
Previous Weekly Low1.3301
Previous Monthly High1.3862
Previous Monthly Low1.3508
Daily Fibonacci 38.2%1.3434
Daily Fibonacci 61.8%1.3413
Daily Pivot Point S11.3405
Daily Pivot Point S21.3349
Daily Pivot Point S31.3317
Daily Pivot Point R11.3492
Daily Pivot Point R21.3523
Daily Pivot Point R31.358

Author

Sagar Dua

Sagar Dua

FXStreet

Sagar Dua is associated with the financial markets from his college days. Along with pursuing post-graduation in Commerce in 2014, he started his markets training with chart analysis.

More from Sagar Dua
Share:

Editor's Picks

EUR/USD eyes nine-day EMA barrier after rebounding from 1.1600

EUR/USD gains ground after registering modest losses in the previous session, trading around 1.1620 during the Asian hours on Friday. The technical analysis of the daily chart suggests an ongoing bearish bias as the pair remains within the descending channel pattern.

GBP/USD: Pound Sterling ticks up against US Dollar in countdown to US NFP

The Pound Sterling trades marginally higher to near 1.3365 against the US Dollar during the Asian trading session on Friday. The GBP/USD pair edges up as the US Dollar ticks down ahead of the United States Nonfarm Payrolls data for February, which will be published at 13:30 GMT.

Gold rises but remains on track for weekly loss in five weeks

Gold price recovers its recent losses from the previous session on Friday. The yellow metal advances as the broader precious metals market rebounds on safe-haven demand. However, the yellow metal is on track for its first weekly decline in five weeks as escalating Middle East tensions push oil prices higher, fueling inflation concerns and reducing bets on Federal Reserve rate cuts.

Bitcoin, Ethereum and Ripple at risk as US-Iran war extends

Bitcoin, Ethereum, and Ripple trade cautiously at press time on Friday, close to key support levels after a roughly 2% pullback the previous day. Bitcoin holds above $71,000, Ethereum at $2,000, and XRP continues to consolidate in a sideways range.

The market compass is pointing at a barrel of Oil

The Asian open is arriving with equities leaning the wrong way, and the reason is not complicated. The market’s compass needle has snapped firmly toward crude. In this tape, oil is not just another input price; it is the gravitational center around which every asset class is orbiting.

Ripple tests recovery strength amid steady ETF inflows, growing retail interest

Ripple (XRP) continues to demonstrate notable resilience as the cryptocurrency market navigates the persistent war in the Middle East after the United States (US) and Israel attacked Iran on Saturday.