|

USD/CAD challenges the 20-day SMA following PCE data from the US

  • US February’s PCE figures largely met expectations.
  • Next week, the focus will be on Nonfarm payrolls for markets to continue placing their bets on the next Fed decisions.
  • Hot data may justify a delay in policy rate cuts beyond June.

The USD/CAD pair is currently trading around the 1.3543 level on Friday, reflecting minor losses after hitting a high of 1.3560 earlier in the session. While investors digest Personal Consumption Expenditures (PCE) figures, the market will turn its attention toward forthcoming employment-related figures that may add further nuance to the Federal Reserve's (Fed) posture on a probable policy rate delay.

The PCE Price Index, preferred by the Federal Reserve for gauging inflation in the US, saw a slight uptick to 2.5% annually in February, up from January's 2.4%, meeting expectations. The monthly increase of 0.3% was slightly below the forecasted 0.4%. Core PCE, which excludes food and energy, also rose by 2.8% annually, aligning with predictions, with a 0.3% monthly increase. The upward revision of January's core PCE figures suggests a continued trend of inflation, potentially prompting the Federal Reserve to maintain higher interest rates.

Future policy decisions will be influenced by incoming data, and the health of the labor market may potentially lead to adjustments in the timing and scale of rate cuts. Strong employment figures could prompt Fed policymakers to delay rate cuts beyond June and possibly reduce the number of cuts projected for 2024 from three to two, potentially bolstering the US Dollar. As for now, the strongest case scenario continues to be three rate cuts in 2024, starting in June.

USD/CAD technical analysis

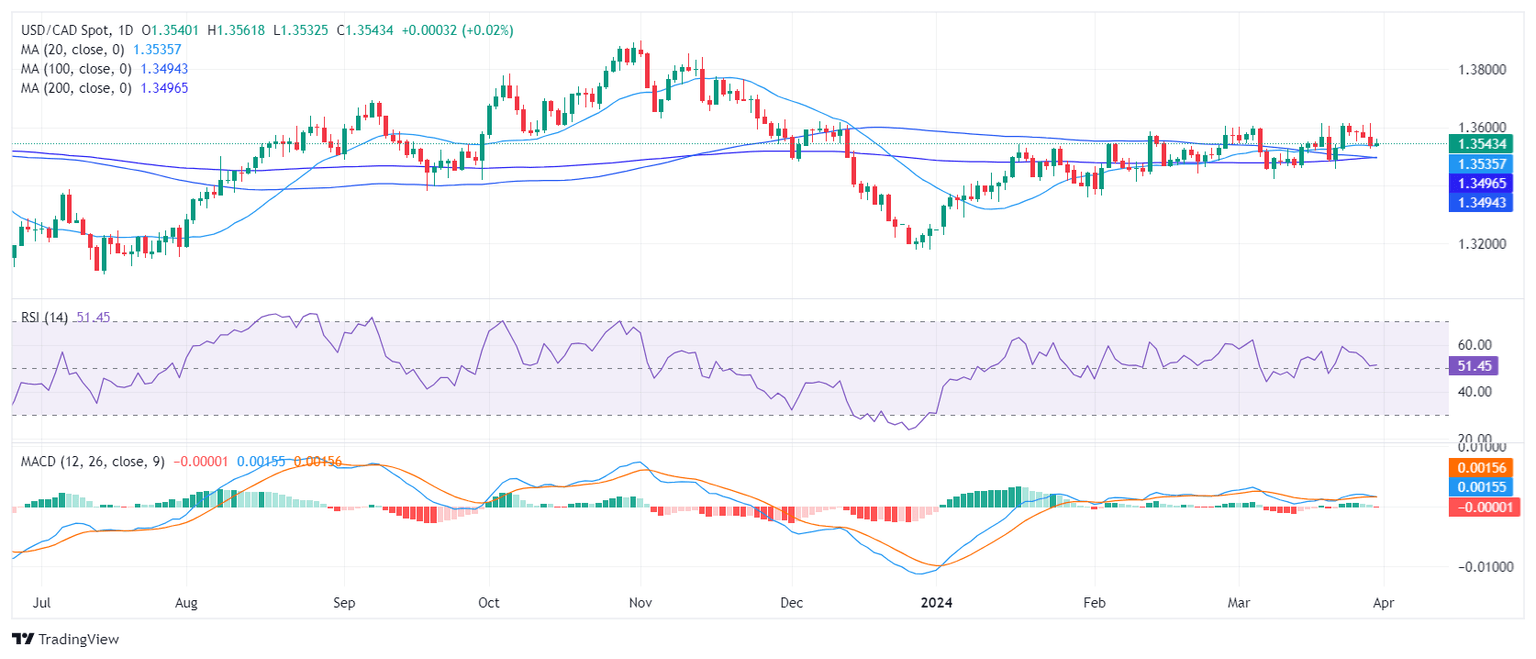
On the daily chart, USD/CAD shows a somewhat stable trend. The Relative Strength Index (RSI) primarily maintains itself in positive territory, indicating that buying pressure slightly dominates the market. However, the Moving Average Convergence Divergence (MACD) histogram printed a new red bar which may imply a weak bullish momentum.

Analyzing the Simple Moving Average (SMA), it is seen that on a broader scale, despite showing a neutral outlook in the short term, the pair is above the 20,100,200-day SMAs. This suggests that the bulls command the overall trend, as long as the bulls defend the challenged 20-day average around the 1.3530 area.

USD/CAD daily chart

USD/CAD

Overview
Today last price1.3541
Today Daily Change0.0001
Today Daily Change %0.01
Today daily open1.354
 
Trends
Daily SMA201.3536
Daily SMA501.3505
Daily SMA1001.3497
Daily SMA2001.3495
 
Levels
Previous Daily High1.3614
Previous Daily Low1.3525
Previous Weekly High1.3614
Previous Weekly Low1.3456
Previous Monthly High1.3606
Previous Monthly Low1.3366
Daily Fibonacci 38.2%1.3559
Daily Fibonacci 61.8%1.358
Daily Pivot Point S11.3506
Daily Pivot Point S21.3471
Daily Pivot Point S31.3417
Daily Pivot Point R11.3594
Daily Pivot Point R21.3649
Daily Pivot Point R31.3683

Author

Patricio Martín

Patricio is an economist from Argentina passionate about global finance and understanding the daily movements of the markets.

More from Patricio Martín
Share:

Markets move fast. We move first.

Orange Juice Newsletter brings you expert driven insights - not headlines. Every day on your inbox.

By subscribing you agree to our Terms and conditions.

Editor's Picks

EUR/USD flatlines below 1.1800 ahead of Fed Minutes

EUR/USD struggles to find direction and continues to move sideways below 1.1800 for the second consecutive day on Tuesday as markets remain in holiday mood. Later in the American session, the Federal Reserve will publish the minutes of the December policy meeting.

GBP/USD retreats to 1.3500 area following earlier climb

GBP/USD loses its traction and trades flat on the day near 1.3500 after rising to the 1.3530 area early Tuesday. Trading conditions remain thin ahead of the New Year holiday, limiting the pair's volatility. The Fed will publish December meeting minutes in the late American session.

Gold aims to regain the ground lost

Gold gathers recovery momentum and advances toward $4,400 on Tuesday after losing more than 4% on Monday. Increased margin requirements on gold and silver futures by the Chicago Mercantile Exchange Group, one of the world’s largest trading floors for commodities, prompted widespread profit-taking and portfolio rebalancing.

Tron steadies as Justin Sun invests $18 million in Tron Inc.

Tron (TRX) trades above $0.2800 at press time on Monday, hovering below the 50-day Exponential Moving Average (EMA) at $0.2859.

Economic outlook 2026-2027 in advanced countries: Solidity test

After a year marked by global economic resilience and ending on a note of optimism, 2026 looks promising and could be a year of solid economic performance. In our baseline scenario, we expect most of the supportive factors at work in 2025 to continue to play a role in 2026.

Crypto market outlook for 2026

Year 2025 was volatile, as crypto often is.  Among positive catalysts were favourable regulatory changes in the U.S., rise of Digital Asset Treasuries (DAT), adoption of AI and tokenization of Real-World-Assets (RWA).