USD/CAD bears take out last month's low, but bulls could emerge
- USD/CAD bears remain in charge but a correction could be imminent.
- US CPI will be the key event for the week and US Dollar.
- Oil surges on China reopening, supportive of CAD.

USD/CAD has been pressured to a key area on the charts as the price of oil rallies while risky currencies benefited from China reopening borders. At the time of writing, USD/CAD is trading at 1.3370 and is down over 0.5% as we head towards the close of the first day of the week.
While there is good news being priced into the markets as China reopens, traders are looking ahead to this week's United States inflation data following a slew of market-impacting economic data last week from the US economy to start the year off. Markets are still digesting Friday’s Nonfarm Payrolls giving credence to a pivot from the Federal Reserve.
''The jobs report was strong overall as Unemployment dropped back to the cycle low of 3.5%, supporting the view that the labour market remains red hot,'' analysts at Brown Brothers Harriman explained. ''However, markets focused on the bigger than expected drop in average hourly earnings to 4.6% year over year.'' However, the analysts argued that ''if the labour market remains as tight as it seems, wages are unlikely to fall much further in the coming months.''
US CPI in focus
Meanwhile, US Services came in dismally poor and the combined jobs report has painted a picture of an economy that is growing and adding jobs, but where overall activity is tilting into recession territory. This prompted traders to sell the dollar against a range of currencies ahead of the US consumer inflation data due later this week.
Price pressures are still front and centre for investors and analysts at TD Securities explained that ''Core prices likely edged higher in December, with the index rising 0.3% month over month after printing 0.2% in November.
''Shelter inflation likely remained the key wildcard, though we look for goods deflation to act again as a major offset. Importantly, gas prices likely provided new relief to the CPI, as they fell sharply in December. All told, our month-over-month forecasts imply 6.5%/5.7% year over year for total/core prices.''
If the data were to surprise to the upside, this would be expected to shift investors' belief that the most likely outcome for the Fed's February meeting is for a 25-basis- point increase.
Oil rises as China reopens borders
Elsewhere, China continued to dismantle much of its strict zero-COVID rules around movement as it reopened its borders to international visitors for the first time since it imposed travel restrictions in March 2020. The BBC reported that ''incoming travellers will no longer need to quarantine, marking a significant change in the country's Covid policy as it battles a surge in cases. They will still require proof of a negative PCR test taken within 48 hours of travelling.''
As a consequence, supportive of the oil-exporting nation's currency, CAD, oil prices surged early on Monday as hopes demand from China will improve as the country issued new import quotas and offered economic support for its flagging economy. Spot West Texas Intermediate crude was last seen up 1.7% to $ 74.91 bbls.
USD/CAD positioning data
When looking at the positioning data, it is worth noting that speculators’ net long USD index positions remain close to their recent lows.
''Despite the hawkish tone of the Fed, net longs are around half the size they were in August, reflecting talk of ‘peak’ Fed rates in recent months. Hopes that the Fed may slacken the pace of rate hikes following the December payrolls report suggest scope for another fall in net longs in the next set of data,'' analysts at Rabobank argued.
The analysts also explained that Canada’s strong December jobs report could have an impact in the next set of CAD's positioning data. ''Speculators’ net short CAD positions dropped lower. The previous week they reached their highest levels since August 2020,'' the analysts said.
USD/CAD technical analysis
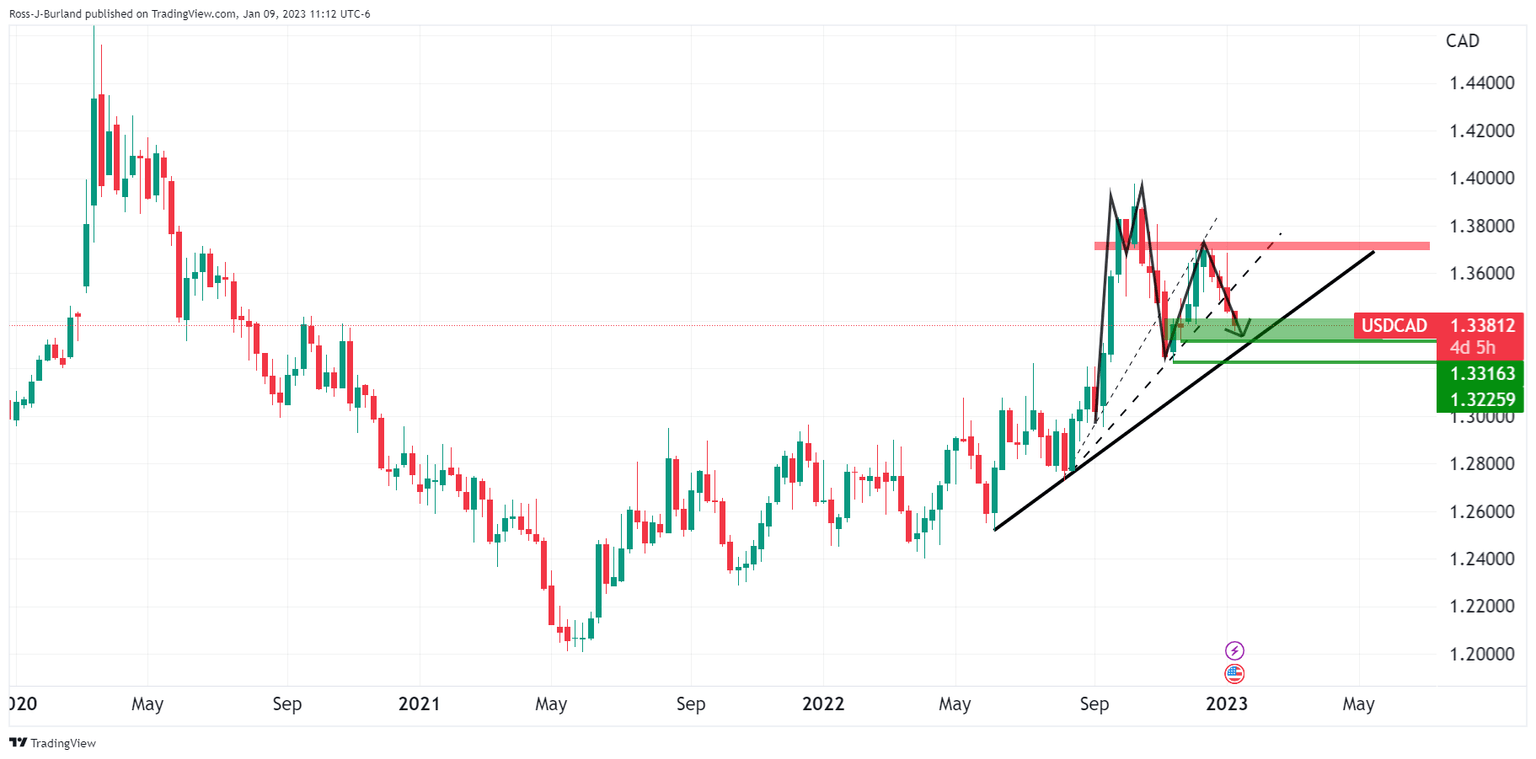
After meeting the weekly M-formation's neckline, USD/CAD is now testing last month's low this week and is penetrating a weekly bullish trendline with another more dominant one in sight below:
USD/CAD weekly chart
USD/CAD eyes 1.3316 and 1.3225 that come in and around the trendline as illustrated.
USD/CAD daily chart
From a daily perspective, given USD/CAD has pulled in higher time frame sellers on a break of last month's low, the initial balance of the week is being set and this could be the low for the week:
If so, trapped shorts will be under pressure. A retest of last week's low near 1.3430 opens the risk of a move beyond and into the Fibonacci scale to target a 38.2% ratio that meets late December and early January lows as the structure around the 1.3470s. Should the bears commit at this juncture, then they will be encouraged to stay the course for a re-run of the recent lows to target a -272% ratio of the corrective range that meets prior lows of 1.3316 that guard the 1.3220s.
USD/CAD H4 chart
From a 4-hour perspective, the M-formation supports the meanwhile bullish thesis as this is a reversion pattern that would be expected to draw in the price towards the anticipated resistance near 1.3470s. A bullish 4-hour close would be encouraging in this regard:
Zoomed in...
Author

Ross J Burland
FXStreet
Ross J Burland, born in England, UK, is a sportsman at heart. He played Rugby and Judo for his county, Kent and the South East of England Rugby team.


