US Stocks Forecast: Wall Street mixed as US yields take the spotlight


  • The S&P 500 added 17.14 points, or 0.38%, to end at 4,536.77.
  • The Nasdaq Composite dropped 6.25 points, or 0.05%, to 15,121.68.
  • The Dow Jones Industrial Average climbed 157.95 points, or 0.45%, to 35,615.26.

The S&P 500 and the Dow were moving towards record highs on Wednesday following strong forecasts from healthcare companies Anthem and Abbott. However, the Nasdaq was unable to match form and wilted below the prior days closing level which likely spurred some additional profit-taking as US yields tried to rebound mid-day. 

The S&P 500 did close up for a sixth-straight session. The Dow hit a new intraday high but moved lower later in the day and it failed to set a record close. According to preliminary data, the S&P 500 added 17.14 points, or 0.38%, to end at 4,536.77 points, while the Nasdaq Composite dropped 6.25 points, or 0.05%, to 15,121.68. The Dow Jones Industrial Average climbed 157.95 points, or 0.45%, to 35,615.26.

US yields in focus 

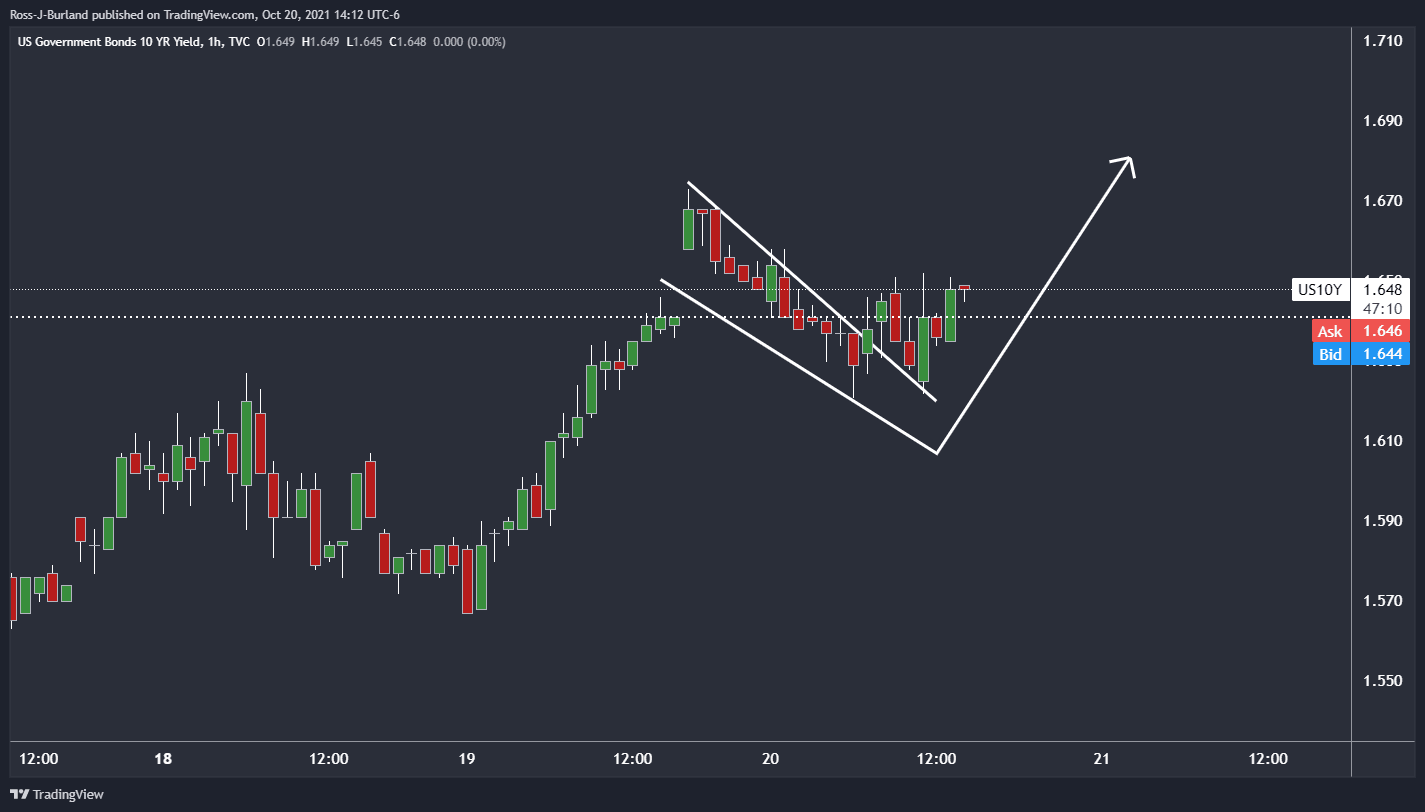
This as the US 10-Year Treasury yield rallied to 1.6730% to score a  fresh five-month high before it sank to 1.62% on Wednesday from a high of 1.673%. However, they are now steadied and could be on the verge of another surge to the upside from a technical perspective as the yield spikes from the 21-50 hour SMMA cloud and building demand at counter-trendline support following a break of the hourly flag resistance:

A rise in yields could put pressure on the benchmarks as investors fret about inflation and rising borrowing costs. 

SP 500

Overview
Today last price 4534.1
Today Daily Change 9.70
Today Daily Change % 0.21
Today daily open 4524.4
 
Trends
Daily SMA20 4396.49
Daily SMA50 4442.64
Daily SMA100 4380.97
Daily SMA200 4187.09
 
Levels
Previous Daily High 4526.6
Previous Daily Low 4481.2
Previous Weekly High 4476.5
Previous Weekly Low 4327.2
Previous Monthly High 4550.75
Previous Monthly Low 4304.4
Daily Fibonacci 38.2% 4509.26
Daily Fibonacci 61.8% 4498.54
Daily Pivot Point S1 4494.87
Daily Pivot Point S2 4465.33
Daily Pivot Point S3 4449.47
Daily Pivot Point R1 4540.27
Daily Pivot Point R2 4556.13
Daily Pivot Point R3 4585.67


Share: Feed news

Information on these pages contains forward-looking statements that involve risks and uncertainties. Markets and instruments profiled on this page are for informational purposes only and should not in any way come across as a recommendation to buy or sell in these assets. You should do your own thorough research before making any investment decisions. FXStreet does not in any way guarantee that this information is free from mistakes, errors, or material misstatements. It also does not guarantee that this information is of a timely nature. Investing in Open Markets involves a great deal of risk, including the loss of all or a portion of your investment, as well as emotional distress. All risks, losses and costs associated with investing, including total loss of principal, are your responsibility. The views and opinions expressed in this article are those of the authors and do not necessarily reflect the official policy or position of FXStreet nor its advertisers. The author will not be held responsible for information that is found at the end of links posted on this page.

If not otherwise explicitly mentioned in the body of the article, at the time of writing, the author has no position in any stock mentioned in this article and no business relationship with any company mentioned. The author has not received compensation for writing this article, other than from FXStreet.

FXStreet and the author do not provide personalized recommendations. The author makes no representations as to the accuracy, completeness, or suitability of this information. FXStreet and the author will not be liable for any errors, omissions or any losses, injuries or damages arising from this information and its display or use. Errors and omissions excepted.

The author and FXStreet are not registered investment advisors and nothing in this article is intended to be investment advice.

Recommended content


Recommended content

Editors’ Picks

EUR/USD stays in daily range slightly below 1.0900

EUR/USD stays in daily range slightly below 1.0900

EUR/USD continues to move up and down in a narrow band slightly below 1.0900 in the second half of the day on Monday. The modest improvement seen in risk mood makes it difficult for the US Dollar to find demand and helps the pair stay in range.

EUR/USD News

GBP/USD treads water above 1.2900 amid risk recovery

GBP/USD treads water above 1.2900 amid risk recovery

GBP/USD is keeping its range play intact above 1.2900 in the American session on Monday. The positive shift seen in risk sentiment doesn't allow the US Dollar to gather strength and helps the pair hold its ground ahead of this week's key data releases.

GBP/USD News

Gold extends slide below $2,400

Gold extends slide below $2,400

Gold stays under persistent bearish pressure after breaking below the key $2,400 level and trades at its lowest level in over a week below $2,390. In the absence of fundamental drivers, technical developments seem to be causing XAU/USD to stretch lower.

Gold News

Crypto Today: Bitcoin is less than 10% away from all-time high as Ethereum ETF approval anticipation brews

Crypto Today: Bitcoin is less than 10% away from all-time high as Ethereum ETF approval anticipation brews

Bitcoin trades around $68,000 early on Monday, less than 10% away from its all-time high of $73,777 on Binance. Ethereum ETF anticipation brews among traders and Ether investment products see inflow of over $45 million in the past week. 

Read more

Election volatility and tech earnings take centre stage

Election volatility and tech earnings take centre stage

The US Dollar managed to end the week higher as Trump Trades ensued. Safe-havens CHF and JPY were also higher while activity currencies such as NOK and NZD underperformed.

Read more

Forex MAJORS

Cryptocurrencies

Signatures