US stock index analysis and trade ideas: A sell signal in the Nasdaq? [Video]
-
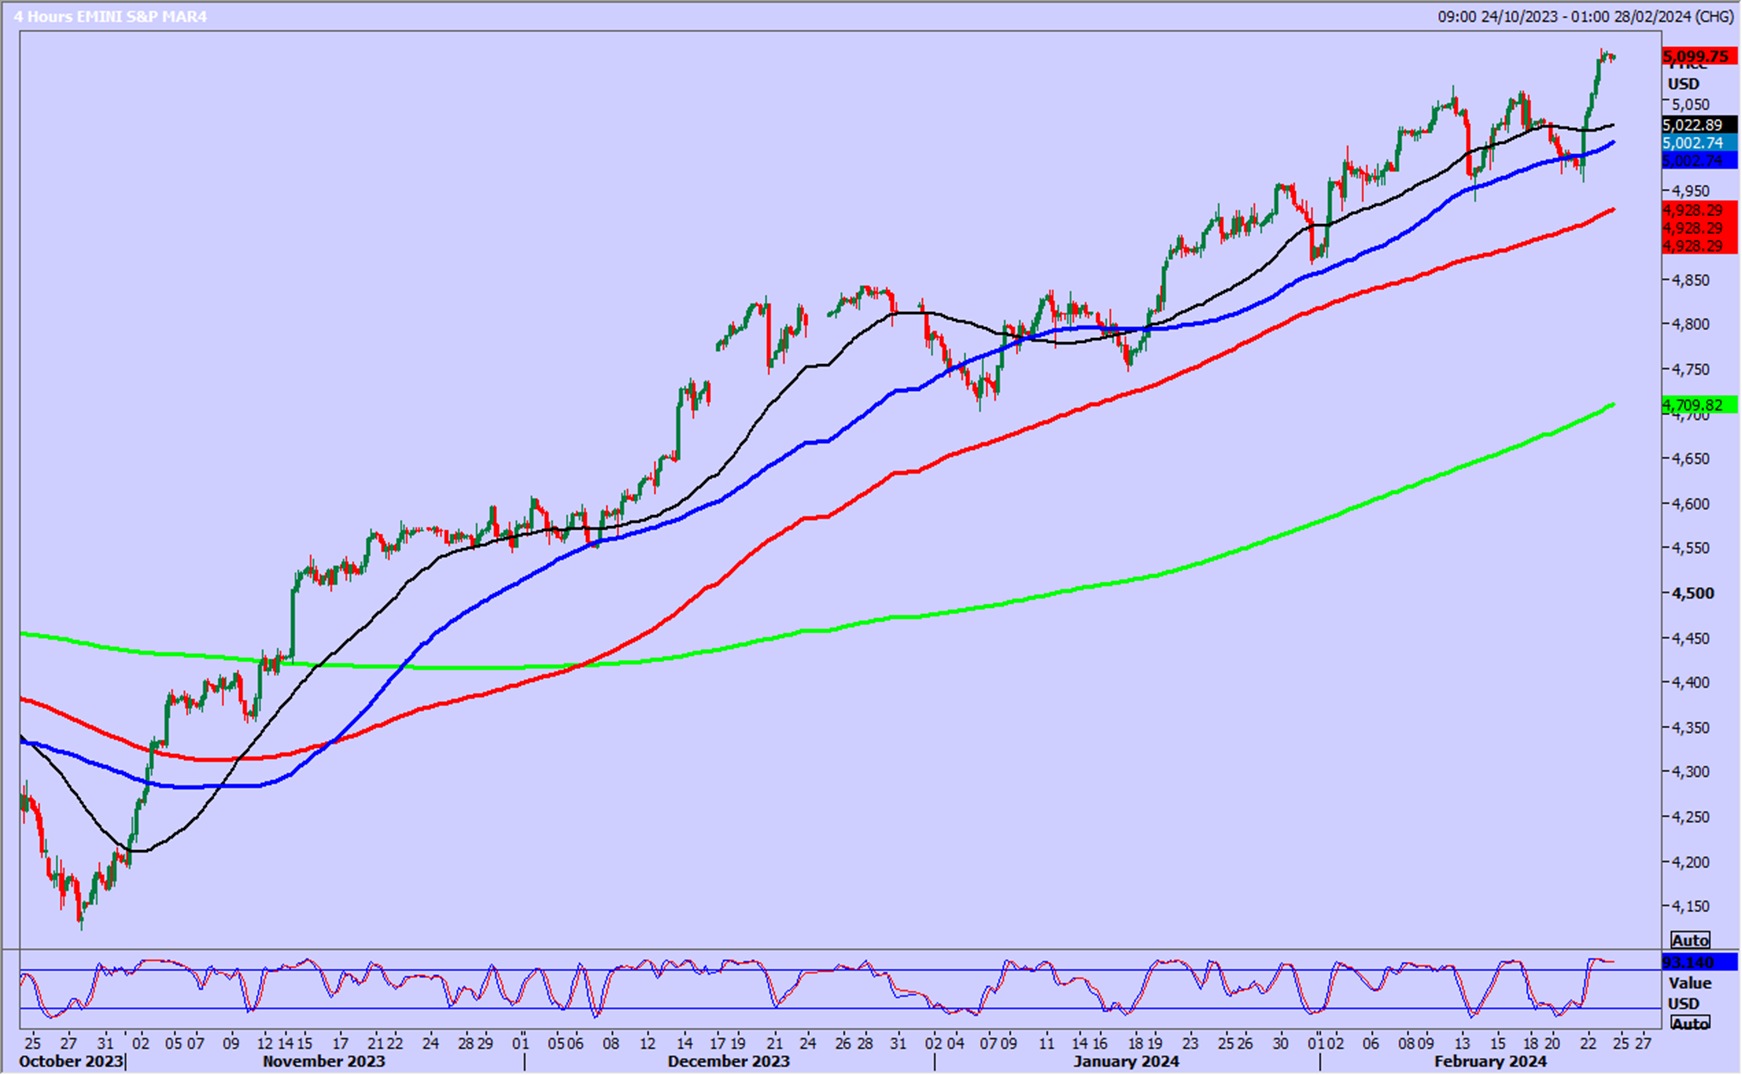
Emini S&P March futures beat the all time high at 5066 for a buy signal & initially hit the next target of 5090/94 then reached 5120/25 on Friday with a high for the day exactly here.
-
Nasdaq March futures had a small push higher but reversed from a new all time high at 18144, to close lower on the day.
-
Emini Dow Jones March futures beat the all time high at 38980-39012 as expected after the short term consolidation, and hit my next target of 39160/220. HOWEVER we only got half way to the next target of 39450/500 on Friday.
![US stock index analysis and trade ideas: A sell signal in the Nasdaq? [Video]](https://editorial.fxstreet.com/images/Markets/Equities/Industries/Media/music-board_XtraLarge.jpg)
Emini S&P: higher as expected in the longer term bull trend as 'buy-the-dip' continues to be the winning strategy. We beat the all time high at 5066 for a new buy signal & initially hit the next target of 5090/94 then 5120/25 with a high for the day exactly here on Friday. Further gains are expected this week to 5140/45.
Any downside correction should find support at 5065/60. Longs need stops below 5050.
Nasdaq March futures could dip to a good support level at 17800/750. Longs need stops below 17700. A break lower meets what should be the best support for this week at 17600/500. Longs need stops below 17400.
We have resistance at the all time high at 18120/145. A sustained break higher is buy signal for this week, initially targeting 18200/220 & 18260/270, probably as far as 18320/340.
Emini Dow Jones March futures beat this week's high at 38900/909 & the all time high at 38980-39012 as expected, after the short term consolidation and hit my next target of 39160/220.
The break above 39270 on Friday only reached 39343. As long as we can hold above support at 39000/38900, we can eventually target 39450/500, probably as far as 36650/700.
However longs at 39000/38900 longs need stops below 38750.
Author

Jason Sen
DayTradeIdeas.co.uk


