Breaking: US GDP came in short of expectations in Q3

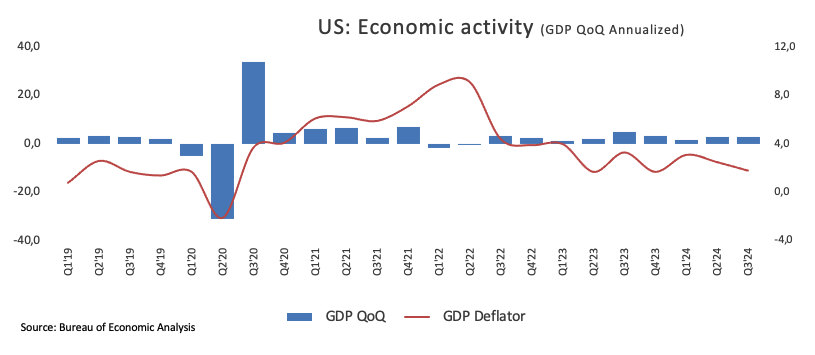
The United States' Gross Domestic Product (GDP) is expected to have expanded at an annualised rate of 2.8% in the third quarter, according to the US Bureau of Economic Analysis' initial estimate released on Wednesday. This growth rate came in short of the market forecast of 3% and follows a 3.0% expansion in the second quarter.
The report further revealed that the Gross Domestic Product Price Index increased by 1.8% in the July-September period, down from the 2.5% increase recorded in the previous quarter. Meanwhile, the core Personal Consumption Expenditures Price Index rose by 2.2% on a quarterly basis, lower than the 2.8% growth recorded in the second quarter but exceeding' forecasts of 2.1% gain.
Market reaction
The Greenback regains some balance and lifts the US Dollar Index (DXY) to daily highs around 104.40 in the wake of the release amidst further gains in the short end and the belly of the yield curve.
US Dollar PRICE Today
The table below shows the percentage change of US Dollar (USD) against listed major currencies today. US Dollar was the strongest against the British Pound.
| USD | EUR | GBP | JPY | CAD | AUD | NZD | CHF | |
|---|---|---|---|---|---|---|---|---|
| USD | 0.05% | 0.45% | 0.00% | 0.10% | -0.14% | -0.02% | 0.18% | |
| EUR | -0.05% | 0.40% | -0.02% | 0.06% | -0.19% | -0.06% | 0.13% | |
| GBP | -0.45% | -0.40% | -0.42% | -0.34% | -0.59% | -0.44% | -0.24% | |
| JPY | 0.00% | 0.02% | 0.42% | 0.08% | -0.15% | -0.04% | 0.18% | |
| CAD | -0.10% | -0.06% | 0.34% | -0.08% | -0.24% | -0.12% | 0.10% | |
| AUD | 0.14% | 0.19% | 0.59% | 0.15% | 0.24% | 0.13% | 0.33% | |
| NZD | 0.02% | 0.06% | 0.44% | 0.04% | 0.12% | -0.13% | 0.21% | |
| CHF | -0.18% | -0.13% | 0.24% | -0.18% | -0.10% | -0.33% | -0.21% |
The heat map shows percentage changes of major currencies against each other. The base currency is picked from the left column, while the quote currency is picked from the top row. For example, if you pick the US Dollar from the left column and move along the horizontal line to the Japanese Yen, the percentage change displayed in the box will represent USD (base)/JPY (quote).
This section below was published as a preview of the US Gross Domestic Product data at 07:00 GMT.
- The United States Gross Domestic Product is expected to grow at an annualised rate of 3.0% in Q3.
- The US economy continues to outperform its G10 peers.
- Investors anticipate the Federal Reserve will reduce interest rates by 25 bps in November.
The US Bureau of Economic Analysis (BEA) is scheduled to release the preliminary estimate of the US Gross Domestic Product (GDP) for the July-September quarter on Wednesday. Analysts anticipate that the report will indicate an annualised economic growth rate of 3.0%, matching the expansion recorded in the previous quarter.
Unveiling US economic growth: GDP forecast insights
This Wednesday, the US Bureau of Economic Analysis (BEA) is set to release the first estimate of the Gross Domestic Product (GDP) for the third quarter (July-September) at 12:30 GMT. Initial projections point to an annualised economic growth rate of 3.0%, in line with the expansion seen in the previous period and indicating a robust pace for the domestic economy, which continues to outpace its G10 counterparts.
The updated Summary of Economic Projections at the Federal Reserve’s (Fed) September meeting revealed several changes from June. The Fed’s median forecast for real GDP growth remained mostly steady at 2.0% for 2024, 2025 and 2026, and 1.8% for the long term.
The Fed also announced that it had raised the median unemployment rate projections to 4.4% for both 2024 and 2025, 4.3% for 2026 and 4.2% in the long run, up from the previous estimates of 4.0%, 4.2%, 4.1% and 4.2%, respectively.
Regarding inflation, the Fed reported that the median estimate for the core Personal Consumption Expenditures (PCE) price index was revised down to 2.6% for 2024, 2.2% for 2025 and 2.0% for 2026,from earlier projections of 2.8%, 2.3% and 2.0%.
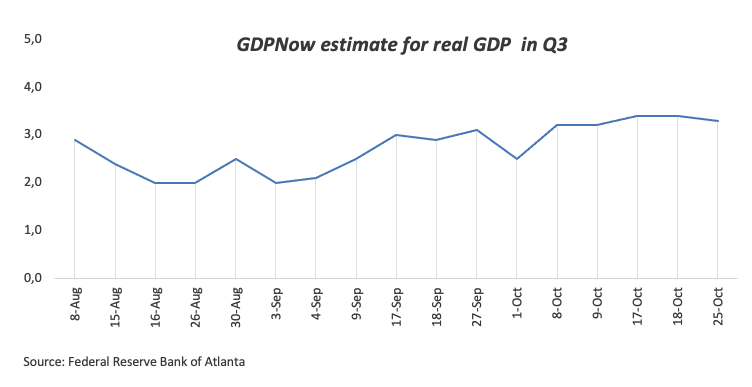
The latest GDPNow forecast from the Federal Reserve Bank of Atlanta, released on Friday, projects that the US economy expanded at an annual rate of 3.3% in the third quarter.
Market observers will be paying close attention to the GDP Price Index, which tracks changes in the prices of goods and services produced domestically, including exports but excluding imports. This index provides a clear view of how inflation is affecting GDP. For the third quarter, the GDP Price Index is expected to increase by 2.7%, up from the 2.5% rise seen in the second quarter.
Along withthe GDP Price Index, the upcoming GDP report will include the quarterly Personal Consumption Expenditures (PCE) Price Index and the core PCE Price Index. These metrics are crucial for assessing inflation, with the core PCE Price Index being the Federal Reserve’s preferred measure.
Ahead of the GDP release, analysts at TD Securities shared their insights: “US Q3 GDP strength is likely to persist with a 3% gain, driven by strong domestic demand and a resilient consumer base.”
When will the GDP print be released, and how can it affect the USD?
The US GDP report will be published at 12:30 GMT on Wednesday. In addition to the headline real GDP figure,changes in private domestic purchases, the GDP Price Index and the Q3 PCE Price Index figures could impact the US Dollar’s (USD) valuation.
Sticky inflation readings in September, combined with the still robust US labour market, have recently fuelled expectations for a smaller Fed rate cut in November.
According to the CME FedWatch Tool, a 25 basis points (bps) rate reduction in November is almost fully priced in.
Looking at the USD, a firm GDP could provide the Fed with additional justification to go for the small option at next month’s meeting. On the other hand, a disappointing GDP print—albeit unlikely—could motivate the Greenback to take a momentary breather, if any at all.
Pablo Piovano, Senior Analyst at FXStreet, gives his view on the technical outlook for the US Dollar Index (DXY): “Amidst the ongoing rally in the US Dollar Index (DXY), the next key target is the October 29 high of 104.63 (October 29). Once this region is cleared, the index could embark on a potential test of the weekly top of 104.79 (July 30).”
“On the downside, strong support remains at the year-to-date low of 100.15 (September 27). Should selling pressure reappear and the DXY breach this level, it may retest the psychological 100.00 milestone, potentially leading to a drop to the 2023 low of 99.57 (July 14)”, added Pablo.
Economic Indicator
Gross Domestic Product Price Index
The Gross Domestic Product (GDP) Price Index, released quarterly by the Bureau of Economic Analysis, measures the change in the prices of goods and services produced in the United States. The prices that Americans pay for imports aren’t included. Changes in the GDP price index are followed as an indicator of inflationary pressures, which may anticipate higher interest rates. A high reading is seen as bullish for the US Dollar (USD), while a low reading is seen as bearish.
Read more.Last release: Thu Sep 26, 2024 12:30
Frequency: Quarterly
Actual: 2.5%
Consensus: -
Previous: 2.5%
Source: US Bureau of Economic Analysis
US Dollar FAQs
The US Dollar (USD) is the official currency of the United States of America, and the ‘de facto’ currency of a significant number of other countries where it is found in circulation alongside local notes. It is the most heavily traded currency in the world, accounting for over 88% of all global foreign exchange turnover, or an average of $6.6 trillion in transactions per day, according to data from 2022. Following the second world war, the USD took over from the British Pound as the world’s reserve currency. For most of its history, the US Dollar was backed by Gold, until the Bretton Woods Agreement in 1971 when the Gold Standard went away.
The most important single factor impacting on the value of the US Dollar is monetary policy, which is shaped by the Federal Reserve (Fed). The Fed has two mandates: to achieve price stability (control inflation) and foster full employment. Its primary tool to achieve these two goals is by adjusting interest rates. When prices are rising too quickly and inflation is above the Fed’s 2% target, the Fed will raise rates, which helps the USD value. When inflation falls below 2% or the Unemployment Rate is too high, the Fed may lower interest rates, which weighs on the Greenback.
In extreme situations, the Federal Reserve can also print more Dollars and enact quantitative easing (QE). QE is the process by which the Fed substantially increases the flow of credit in a stuck financial system. It is a non-standard policy measure used when credit has dried up because banks will not lend to each other (out of the fear of counterparty default). It is a last resort when simply lowering interest rates is unlikely to achieve the necessary result. It was the Fed’s weapon of choice to combat the credit crunch that occurred during the Great Financial Crisis in 2008. It involves the Fed printing more Dollars and using them to buy US government bonds predominantly from financial institutions. QE usually leads to a weaker US Dollar.
Quantitative tightening (QT) is the reverse process whereby the Federal Reserve stops buying bonds from financial institutions and does not reinvest the principal from the bonds it holds maturing in new purchases. It is usually positive for the US Dollar.
Author

FXStreet Team
FXStreet


