US equities broadly closed lower on Tuesday, NASDAQ ekes out a small gain as investors blink


  • US equity indexes closed mostly in the red as the risk rally draws to a close.
  • Risk appetite is struggling in the week following last Friday’s 2024.
  • 2023’s last-quarter rally drew to a close as equities struggle in January.

US major equity indexes closed mostly lower on Tuesday with tech stocks leading the charge down the charts, though the NASDAQ composite index managed to squeeze out a minor gain while the rest of the indexes declined heading into a hefty midweek reporting window.

Tuesday saw 113 companies drop earnings reports either throughout the day or after the closing bell, but investors are broadly twisting in place, pulling back slightly from equities ahead of Thursday’s US Consumer Price Index (CPI) inflation print.

Investors were knocked off increased expectations of a faster pace of rate cuts from the Federal Reserve (Fed) after last Friday’s Nonfarm Payrolls (NFP) saw drastic downside revisions to previous prints despite a bumper reading for the most recent dataset, and market bets of the first Fed rate cut coming as soon as March are beginning to recede.

The Dow Jones Industrial Average (DJIA) fell 0.42% on Tuesday, shedding 157.85 points to close at $37,525.16, while the Standard & Poor’s major equity index fell 7.04 points to close down 0.15% at $4,756.50.

The Russell 2000 equity index slid a full percentage point, losing nearly 21 points to close at $1,98.04. The NASDAQ composite, meanwhile, bucked the trend to end Tuesday up a scant 0.09%, climbing just under 14 points to end the day at $14,857.71.

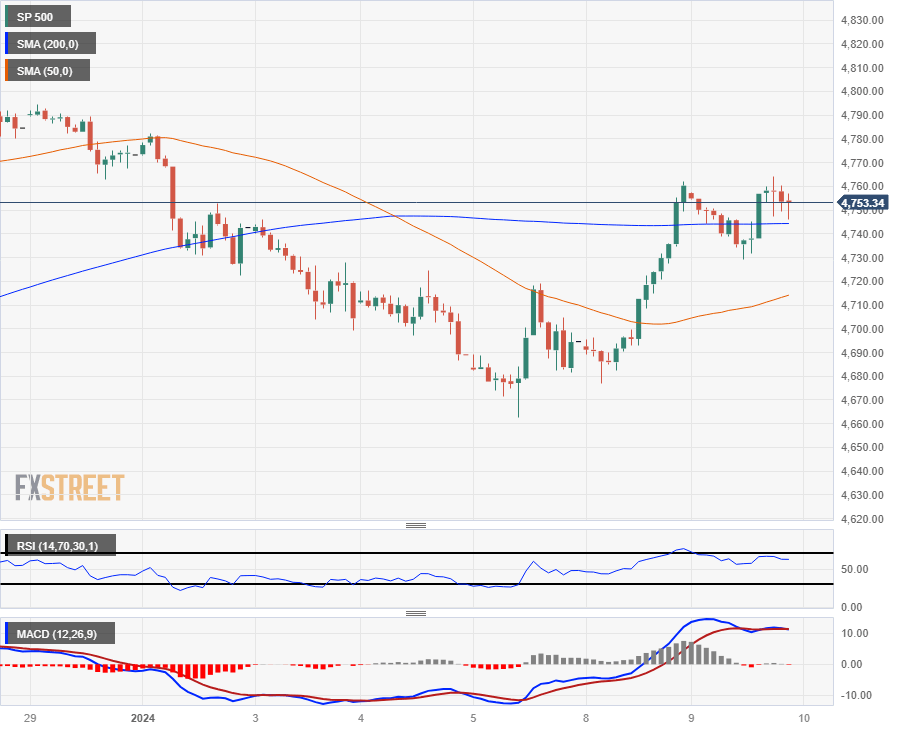
S&P 500 Technical Outlook

The S&P 500 skidded to a halt after Monday’s hopeful gains, getting hung up on the 200-hour Simple Moving Average (SMA) near $4,755, and near-term momentum is draining away as investors get snagged near $4,760.

Despite near-term declines, the S&P 500 remains well-bid, trading just below the $4,800 handle on daily candlesticks and remains up over 16% from late October’s bottom bids near $4,100.

S&P 500 Hourly Chart

S&P 500 Technical Levels

SP 500

Overview
Today last price 4753.34
Today Daily Change -6.91
Today Daily Change % -0.15
Today daily open 4760.25
 
Trends
Daily SMA20 4727.6
Daily SMA50 4571.05
Daily SMA100 4466.93
Daily SMA200 4386.02
 
Levels
Previous Daily High 4762.08
Previous Daily Low 4676.8
Previous Weekly High 4782.07
Previous Weekly Low 4662.84
Previous Monthly High 4794.65
Previous Monthly Low 4542.87
Daily Fibonacci 38.2% 4729.5
Daily Fibonacci 61.8% 4709.38
Daily Pivot Point S1 4704.01
Daily Pivot Point S2 4647.76
Daily Pivot Point S3 4618.73
Daily Pivot Point R1 4789.29
Daily Pivot Point R2 4818.32
Daily Pivot Point R3 4874.57


Share: Feed news

Information on these pages contains forward-looking statements that involve risks and uncertainties. Markets and instruments profiled on this page are for informational purposes only and should not in any way come across as a recommendation to buy or sell in these assets. You should do your own thorough research before making any investment decisions. FXStreet does not in any way guarantee that this information is free from mistakes, errors, or material misstatements. It also does not guarantee that this information is of a timely nature. Investing in Open Markets involves a great deal of risk, including the loss of all or a portion of your investment, as well as emotional distress. All risks, losses and costs associated with investing, including total loss of principal, are your responsibility. The views and opinions expressed in this article are those of the authors and do not necessarily reflect the official policy or position of FXStreet nor its advertisers. The author will not be held responsible for information that is found at the end of links posted on this page.

If not otherwise explicitly mentioned in the body of the article, at the time of writing, the author has no position in any stock mentioned in this article and no business relationship with any company mentioned. The author has not received compensation for writing this article, other than from FXStreet.

FXStreet and the author do not provide personalized recommendations. The author makes no representations as to the accuracy, completeness, or suitability of this information. FXStreet and the author will not be liable for any errors, omissions or any losses, injuries or damages arising from this information and its display or use. Errors and omissions excepted.

The author and FXStreet are not registered investment advisors and nothing in this article is intended to be investment advice.

Open Account
Open Account
Open Account
Open Account
Open Account
Open Account

Recommended content


Recommended content

Editors’ Picks

EUR/USD bounces off lows, retests 1.1370

EUR/USD bounces off lows, retests 1.1370

Following an early drop to the vicinity of 1.1310, EUR/USD now manages to regain pace and retargets the 1.1370-1.1380 band on the back of a tepid knee-jerk in the US Dollar, always amid growing optimism over a potential de-escalation in the US-China trade war.

EUR/USD News
GBP/USD trades slightly on the defensive in the low-1.3300s

GBP/USD trades slightly on the defensive in the low-1.3300s

GBP/USD remains under a mild selling pressure just above 1.3300 on Friday, despite firmer-than-expected UK Retail Sales. The pair is weighed down by a renewed buying interest in the Greenback, bolstered by fresh headlines suggesting a softening in the rhetoric surrounding the US-China trade conflict.

GBP/USD News
Gold remains offered below $3,300

Gold remains offered below $3,300

Gold reversed Thursday’s rebound and slipped toward the $3,260 area per troy ounce at the end of the week in response to further improvement in the market sentiment, which was in turn underpinned by hopes of positive developments around the US-China trade crisis.

Gold News
Ethereum: Accumulation addresses grab 1.11 million ETH as bullish momentum rises

Ethereum: Accumulation addresses grab 1.11 million ETH as bullish momentum rises

Ethereum saw a 1% decline on Friday as sellers dominated exchange activity in the past 24 hours. Despite the recent selling, increased inflows into accumulation addresses and declining net taker volume show a gradual return of bullish momentum.

Read more
Week ahead: US GDP, inflation and jobs in focus amid tariff mess – BoJ meets

Week ahead: US GDP, inflation and jobs in focus amid tariff mess – BoJ meets

Barrage of US data to shed light on US economy as tariff war heats up. GDP, PCE inflation and nonfarm payrolls reports to headline the week. Bank of Japan to hold rates but may downgrade growth outlook. Eurozone and Australian CPI also on the agenda, Canadians go to the polls.

Read more
The Best brokers to trade EUR/USD

The Best brokers to trade EUR/USD

SPONSORED Discover the top brokers for trading EUR/USD in 2025. Our list features brokers with competitive spreads, fast execution, and powerful platforms. Whether you're a beginner or an expert, find the right partner to navigate the dynamic Forex market.

Read More

Forex MAJORS

Cryptocurrencies

Signatures

Best Brokers of 2025