US dollar teases reversal traders, Golden Cross underpins
- The US dollar is attempting to come up for air into the final sessions of the week.
- The Gold Cross was a recent technical development that would be expected to underpin strength in USD going forward.
- Reversal traders are selling point D to target a mean reversion or lower.
The US dollar is attempting to reclaim the 93 area on the back of a combination of bullish tendencies that would be expected to support the greenback for the near and medium-terms.
However, from a technical perspective, a deeper correction could be on the cards which can be rationalised as the market tempers down the demand for the US dollar markets while the final data is assessed leading into the 26-28 Aug Jackson Hole event.
Meanwhile, the tapering debate remains and the US bond yields rose on Thursday following mediocre results in the 30yr auction, as analysts at Westpac note, ''markets continue to focus on the Fed’s tapering signals and any catalysts to jump back onto the reflation trade.''
2-year government bond yields rose from 0.22% to 0.23%, and 10-year government bond yields rose from 1.33% to 1.37%.
The mix of the type of data overnight was ideal for the US dollar bulls for it complicated last week's solid Nonfarm Payrolls data and helped to beef up the inflation outlook despite the prior day's underwhelming Consumer Price Index outcome.
First of all, a much stronger than anticipated Producer Price Index data helped lift yields and steepen the curve.
July PPI was rising 1% MoM at both the headline and ex-food and energy level.
''Most of the increase was attributable to an increase in services prices, partly reflecting stronger margins for wholesalers and retailers,'' analysts at ANZ Bank said.
''This contrasts with yesterday’s CPI data, where core inflation lifted more slowly than expected. Taken together, the market interpreted the data as another sign that pipeline inflation pressures are ongoing, and that could prompt the Fed to consider tapering sooner rather than later.''
Additionally, US Initial Jobless claims fell, as expected, to 375k.
''A decline occurred in most states (including Florida, -6k), which may boost confidence that the higher COVID numbers have not had a large knock-on effect on economic activity. Continuing claims also declined to 2,866k,'' the analysts at ANZ Bank said.
DXY technical analysis
The US dollar is attempting to recover the CPI losses from the prior day, closing higher but still below the recent tops at 93.1920.
Below there, then the downside is vulnerable towards the midpoint of the 92 area that meets the 61.8% Fibonacci retracement level at 92.52.
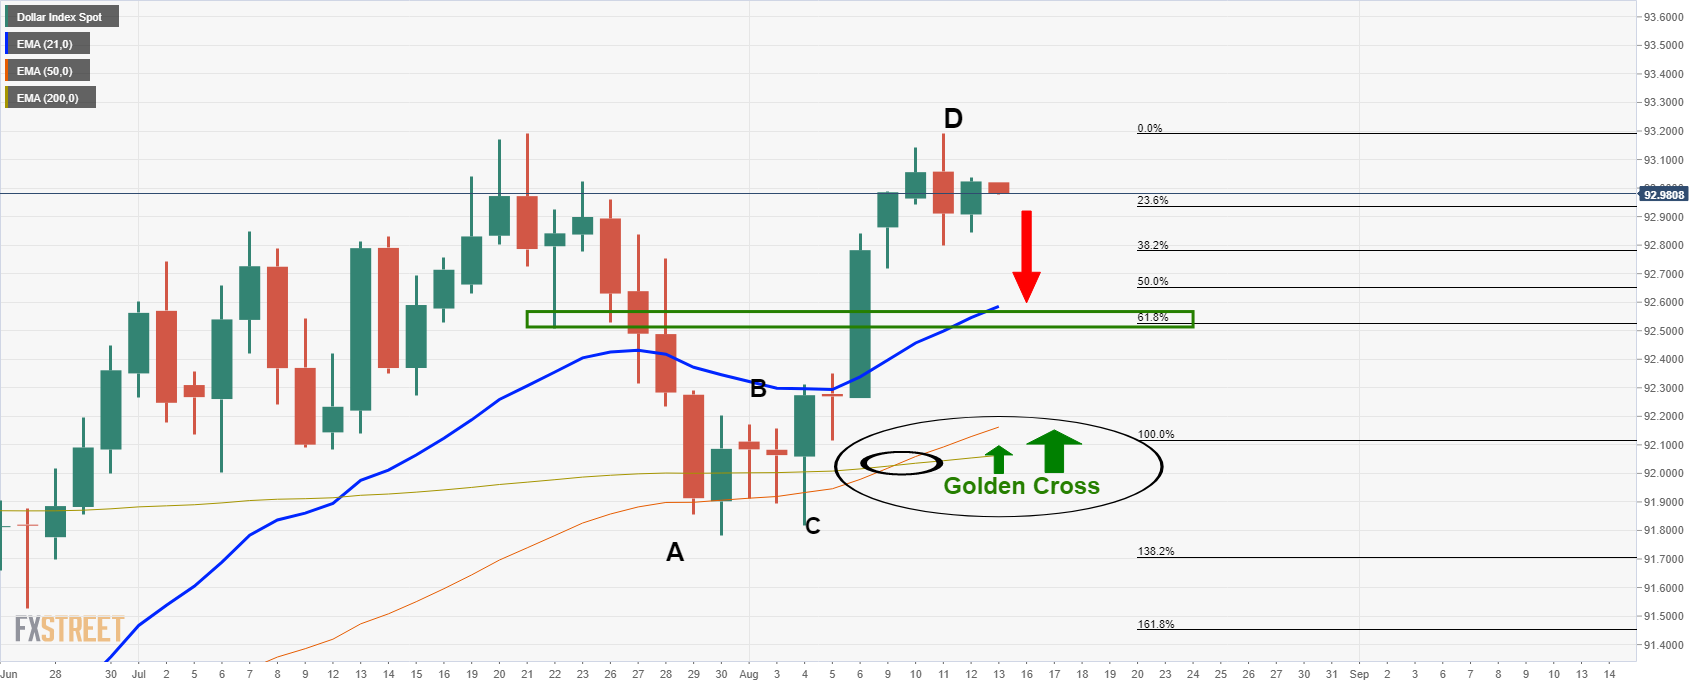
Overall, the Golden Cross (50/200-day EMA bullish cross over) would be expected to lead to a higher US dollar in the coming days and weeks.
However, the confluence of the 21-day EMA and July 22 lows is a compelling reversion target for the bears that are otherwise having to contend with some meanwhile strength in the greenback.
Projected path for DXY
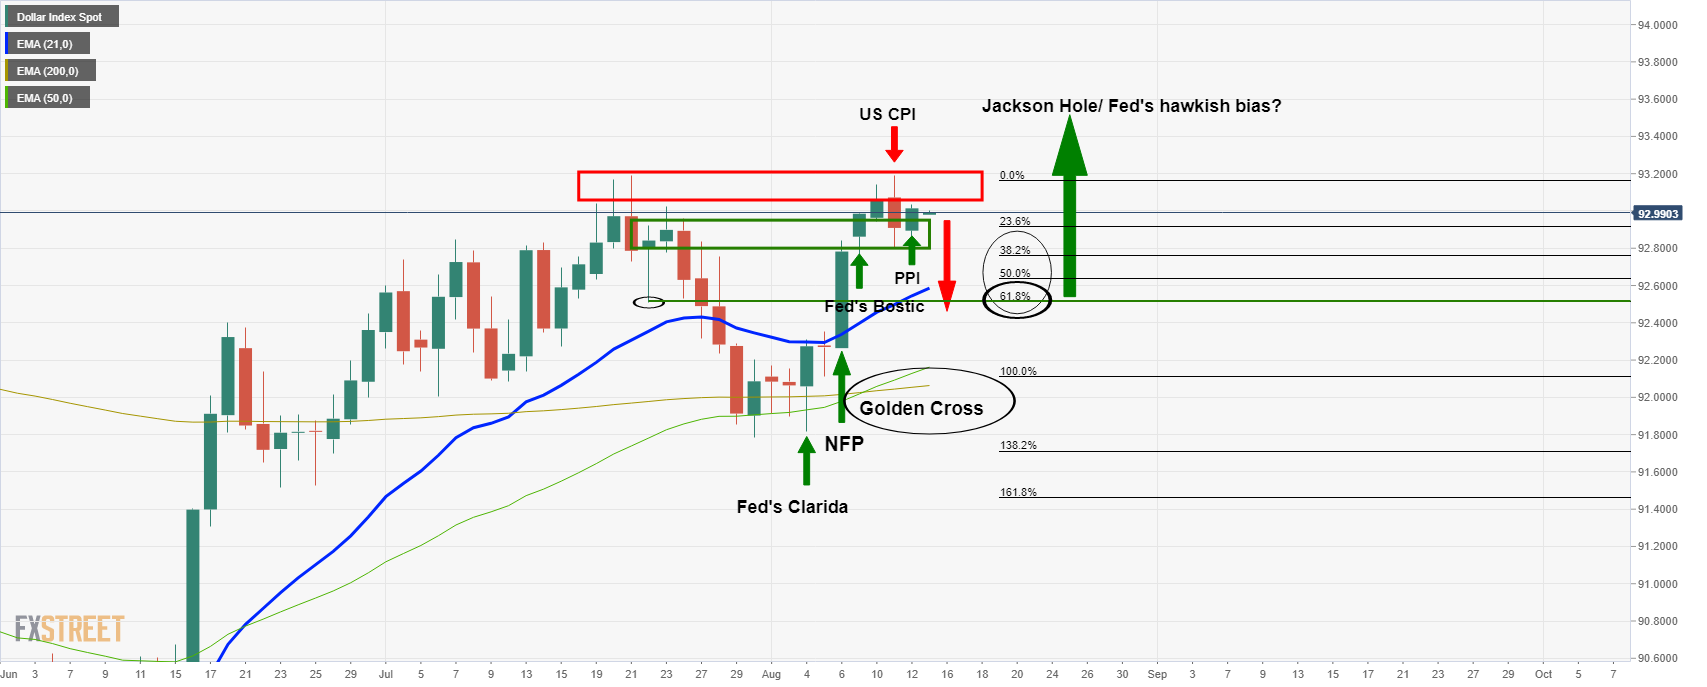
The above chart illustrates the series of fundamental events that have led to the recent Golden Cross on the daily time frame.
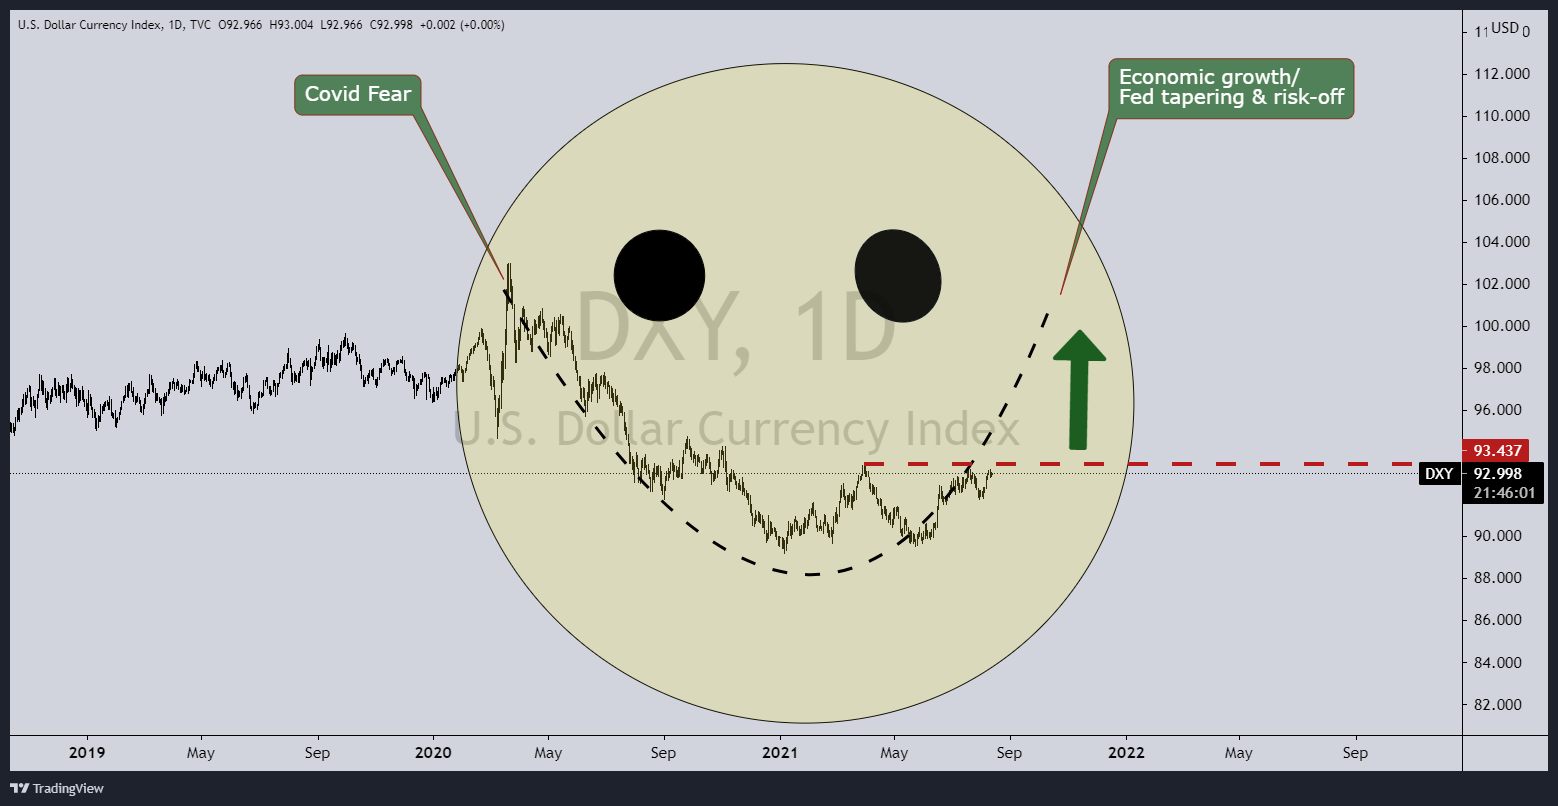
The US dollar smile theory
Meanwhile, the US dollar smile theory is in play.
That is to say, strong US data are feeding into increased dollar bullishness and the Fed continues to take tentative steps towards tapering. On the other hand, risk-off and uncertainty pertaining to the global pandemic are also expected to support the US dollar recently.
Therefore, the greenback is likely to benefit in either situation. Hence, the ''dollar smile'' as the dollar turns up at both ends of the risk spectrum.
Note that 93.437 March 31 highs will be a critical level of resistance:
''We do not believe the market is prepared for a September tapering announcement,'' analysts at Nomura said in a note on Thursday.
''This scenario may see large FX moves in JPY, EUR, IDR, and THB (vs. USD). Higher HK rates and AUD bond outperformance are likely.''
Author

Ross J Burland
FXStreet
Ross J Burland, born in England, UK, is a sportsman at heart. He played Rugby and Judo for his county, Kent and the South East of England Rugby team.


