|

US Dollar Index technical analysis: DXY remains under pressure below the 98.10 resistance

  • DXY (US Dollar Index) is recovering after the sharp Friday’s decline. 

  • The levels to beat for bears are at 97.95 and 97.85.
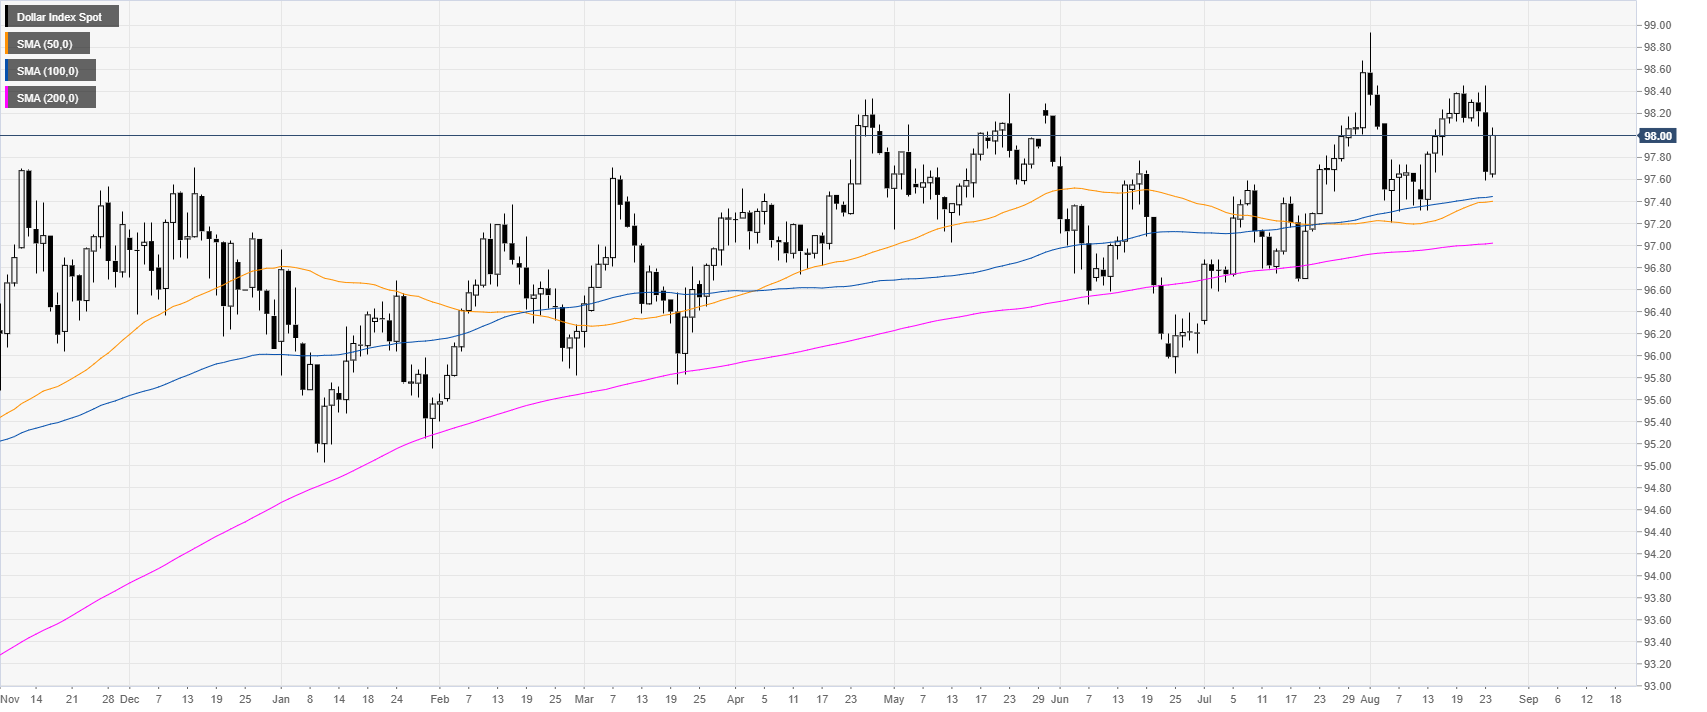
DXY daily chart

 
DXY (US Dollar Index) trading in a bull trend above the main daily simple moving averages (DSMAs). The market is consolidating the sharp drop seen last Friday.
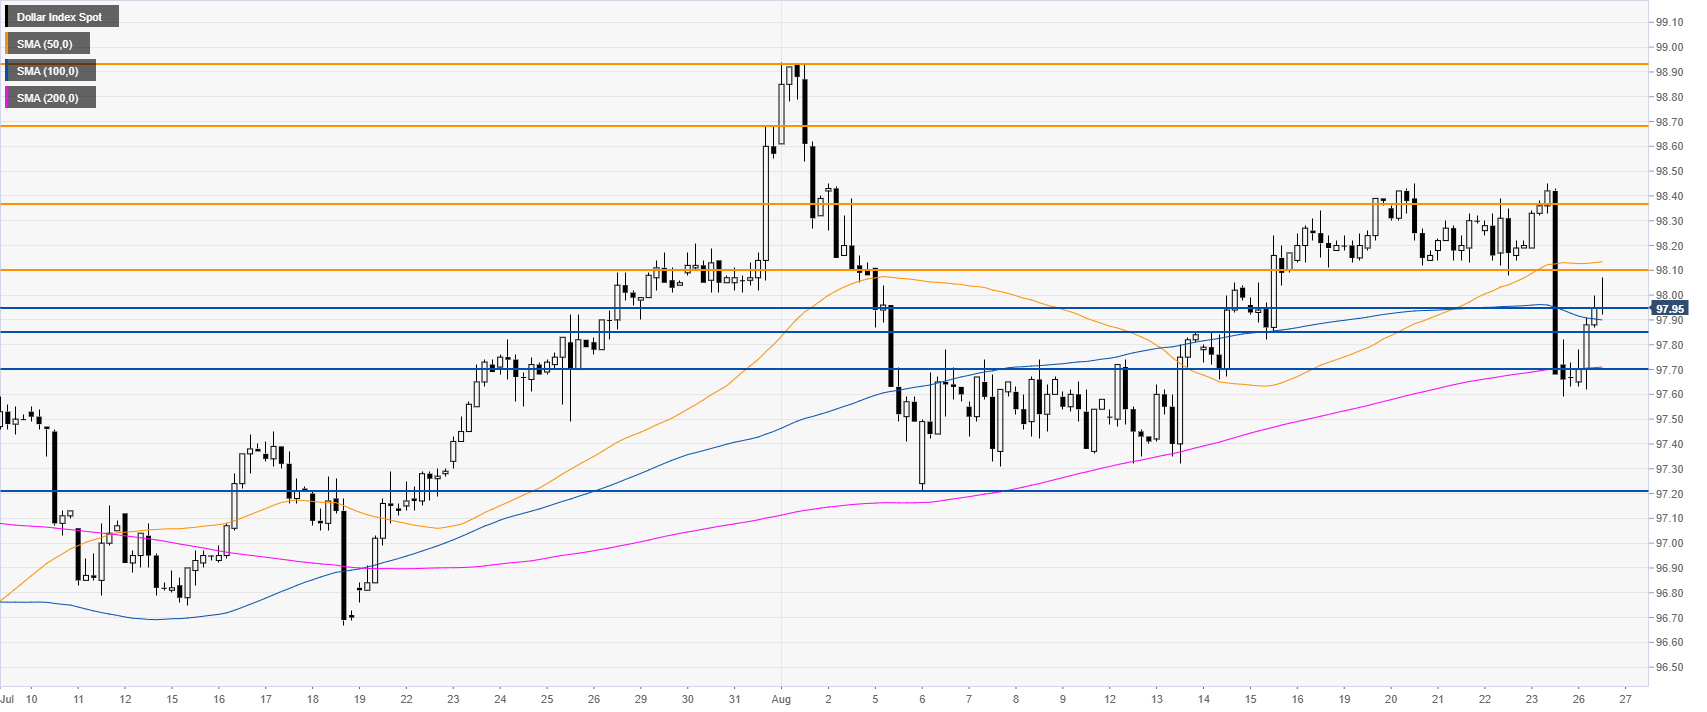


DXY 4-hour chart

 
DXY remains under pressure below 98.10 and the 50 SMA. Bears will need to clear 97.95/85 and 97.70 support if they want to create a meaningful breakdown towards the 97.20 level.
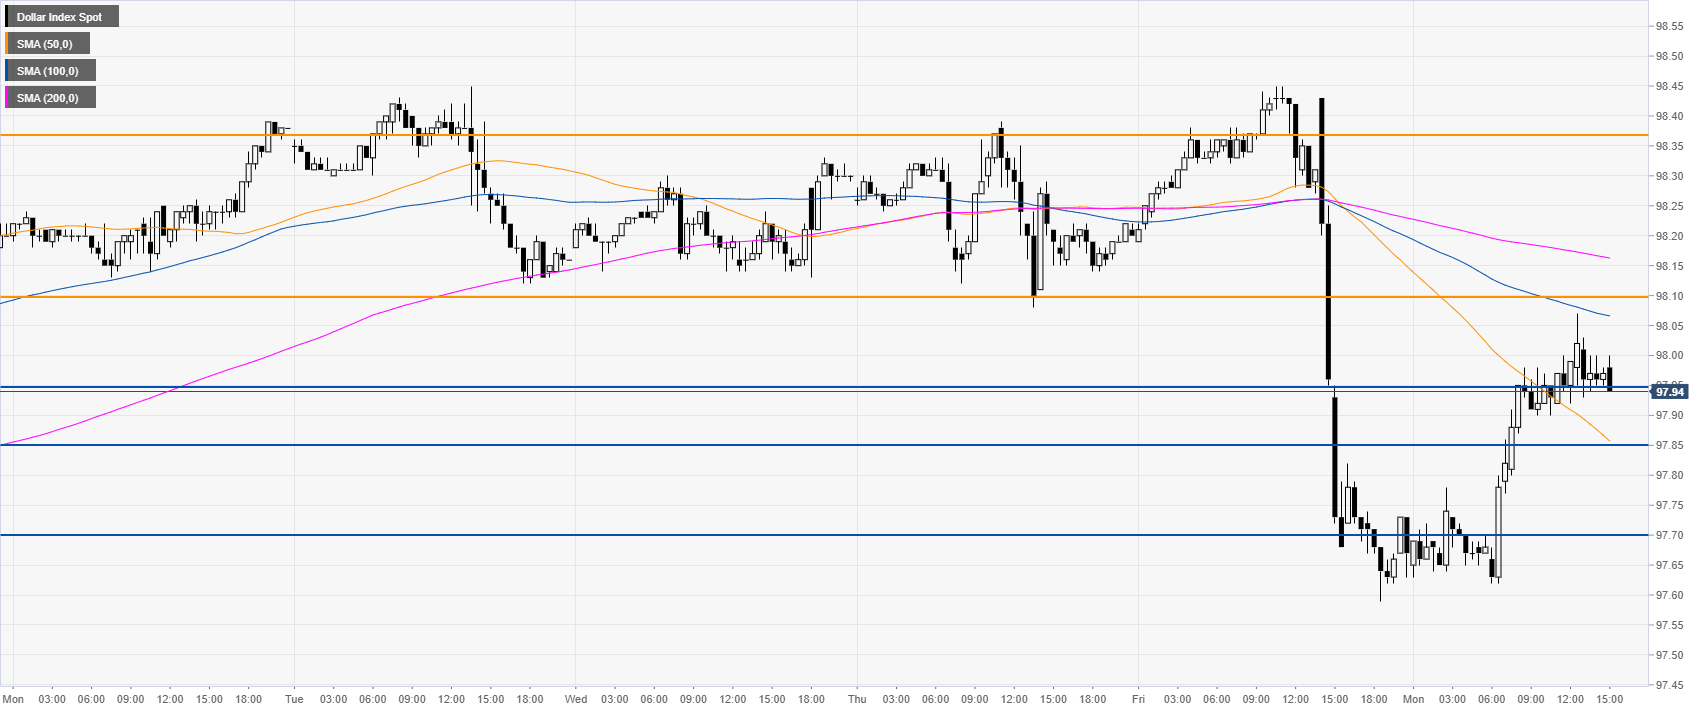


DXY 30-minute chart

 
The Greenback is trading below a downward sloping 100/200 SMAs, suggesting bearish momentum in the short term. The main resistance to break for bulls is the 98.10 level.
 

Additional key levels

Dollar Index Spot

Overview
Today last price97.95
Today Daily Change0.28
Today Daily Change %0.29
Today daily open97.67
 
Trends
Daily SMA2097.97
Daily SMA5097.39
Daily SMA10097.44
Daily SMA20097.01
Levels
Previous Daily High98.45
Previous Daily Low97.59
Previous Weekly High98.45
Previous Weekly Low97.59
Previous Monthly High98.68
Previous Monthly Low96.28
Daily Fibonacci 38.2%97.92
Daily Fibonacci 61.8%98.12
Daily Pivot Point S197.36
Daily Pivot Point S297.04
Daily Pivot Point S396.5
Daily Pivot Point R198.22
Daily Pivot Point R298.76
Daily Pivot Point R399.08

Author

Flavio Tosti

Flavio Tosti

Independent Analyst


More from Flavio Tosti
Share:

Editor's Picks

EUR/USD hovers around 1.1850 ahead of FOMC Minutes

EUR/USD stays on the back foot around 1.1850 in the European session on Wednesday, pressured by renewed US Dollar demand. Traders now look forward to the Minutes of the Fed's January monetary policy meeting for fresh signals on future rate cuts. 

GBP/USD defends 1.3550 after UK inflation data

GBP/USD is holding above 1.3550 in Wednesday's European morning, little changed following the UK Consumer Price Index (CPI) data release. The UK inflation eased as expected in January, reaffirming bets for a March BoE interest rate cut, especially after Tuesday's weak employment report. 

Gold: Is the $5,000 level back in sight?

Gold snaps a two-day downtrend, as recovery gathers traction toward $5,000 on Wednesday. The US Dollar recovers from the overnight sell-off as rebalancing trades resume ahead of Fed Minutes. The 38.2% Fib support holds on the daily chart for now. What does that mean for Gold?

Pi Network rally defies market pressure ahead of its first anniversary

Pi Network is trading above $0.1900 at press time on Wednesday, extending the weekly gains by nearly 8% so far. The steady recovery is supported by a short-term pause in mainnet migration, which reduces pressure on the PI token supply for Centralized Exchanges. The technical outlook focuses on the $0.1919 resistance as bullish momentum increases.

UK jobs market weakens, bolstering rate cut hopes

In the UK, the latest jobs report made for difficult reading. Nonetheless, this represents yet another reminder for the Bank of England that they need to act swiftly given the collapse in inflation expected over the coming months. 

Top 3 Price Prediction: Bitcoin, Ethereum, and Ripple face downside risk as bears regain control

Bitcoin, Ethereum, and Ripple remain under pressure on Wednesday, with the broader trend still sideways. BTC is edging below $68,000, nearing the lower consolidating boundary, while ETH and XRP also declined slightly, approaching their key supports.