|

US Dollar Index technical analysis: DXY printing fresh 2019 highs as price hit levels not seen since May 2017

  • DXY (US Dollar Index) is breaking above the 2019 high as the market is trading at its highest since May 2017.
  • The next key resistance can be seen at the 99.27 level.
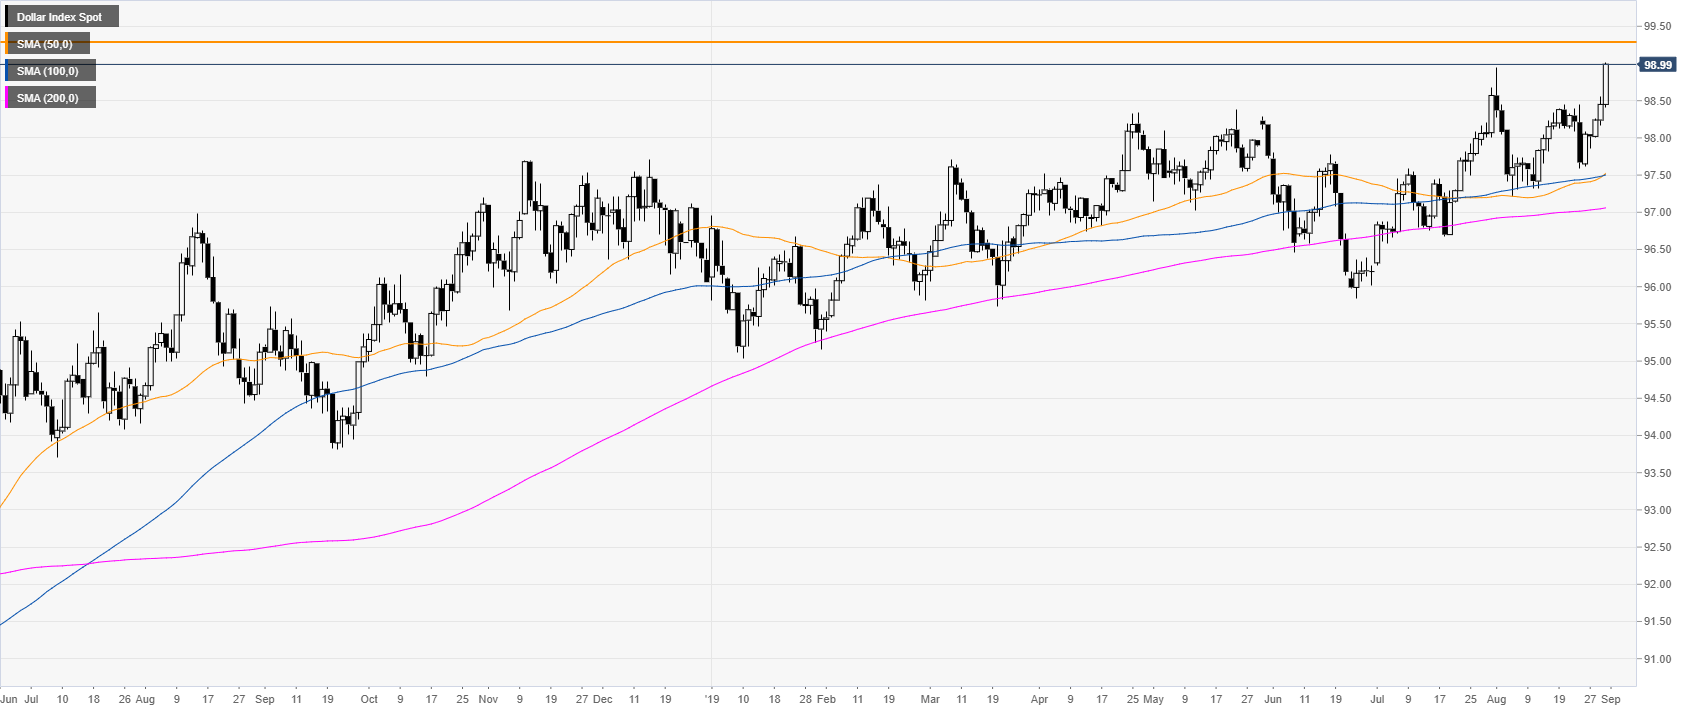
 

DXY daily chart

 
DXY (US Dollar Index) is trading in a bull trend above the main daily simple moving averages (DSMAs) as the market is trading at is highest since May 2017.
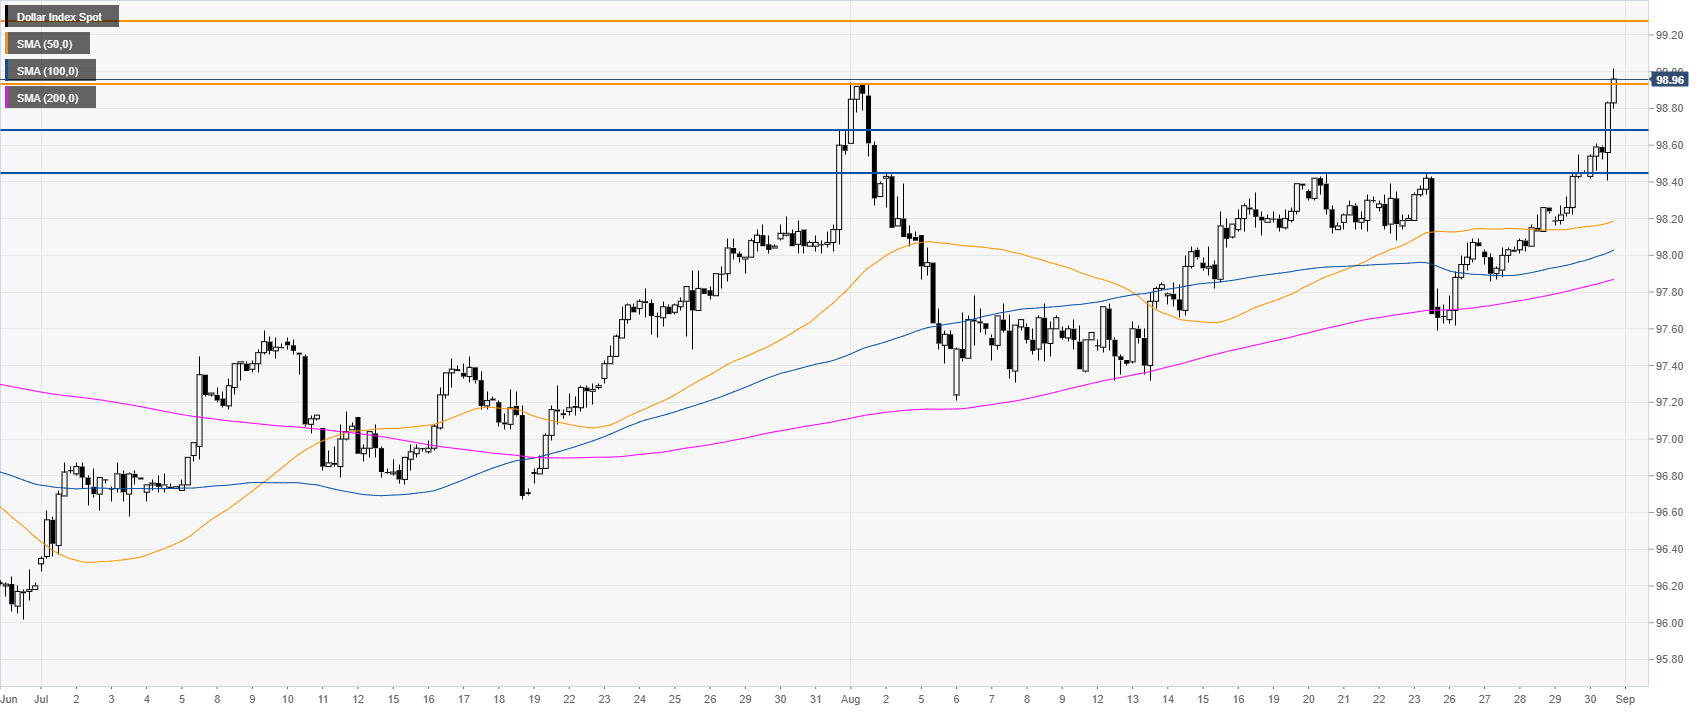
DXY 4-hour chart

 
DXY broke above 98.94 resistance, the previous 2019 high, opening the gates for a potential continuation up towards 99.27, previous key level. If the market holds above the 98.94 level, it would be seen as a bullish sign. 
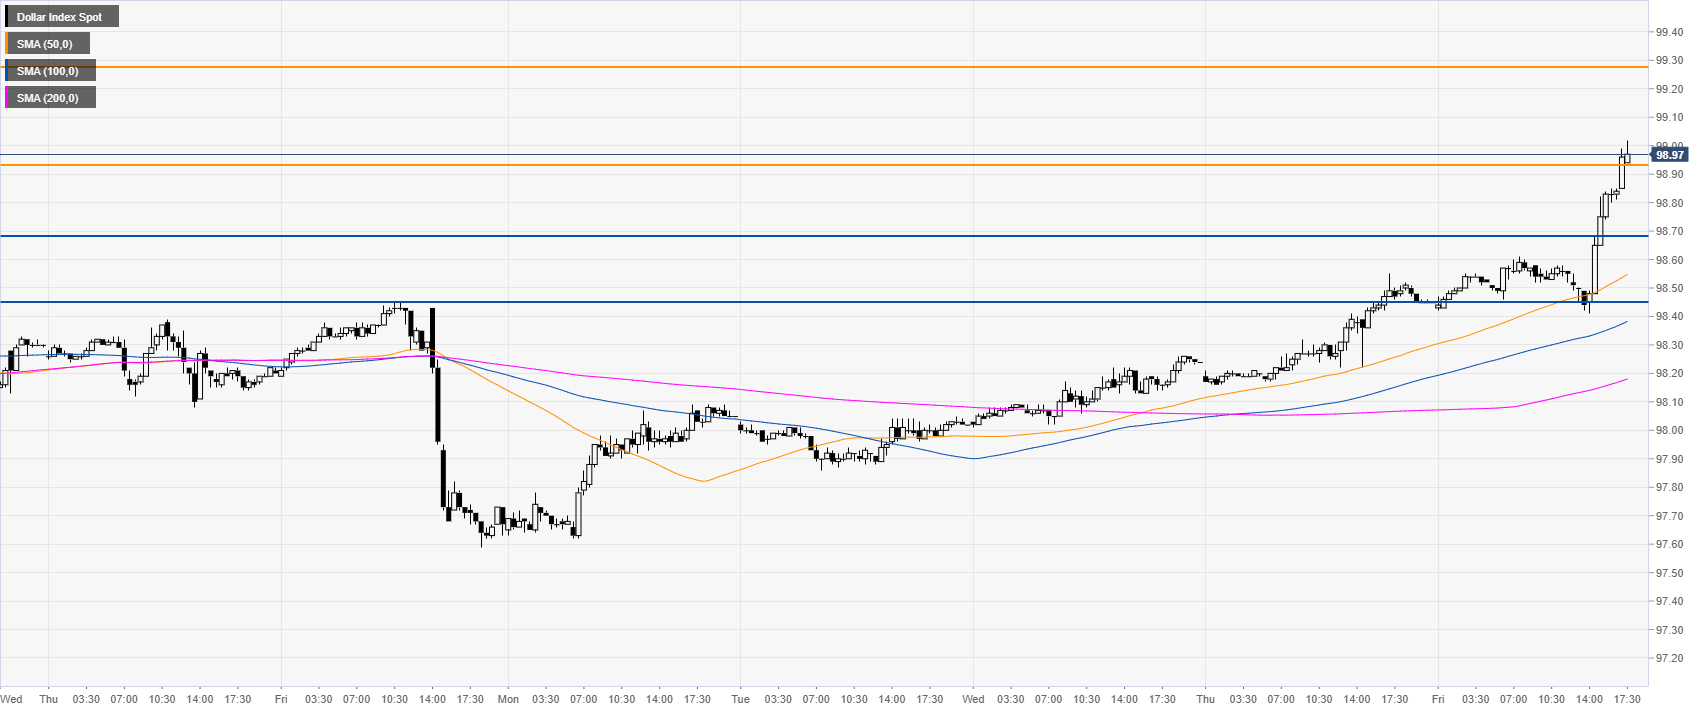


DXY 30-minute chart

 
DXY is trading above the main SMAs, suggesting bullish momentum in the short term. Immediate support is seen at the 98.94 and the 98.68 levels. 
 

Additional key levels

Dollar Index Spot

Overview
Today last price99.02
Today Daily Change0.57
Today Daily Change %0.58
Today daily open98.45
 
Trends
Daily SMA2097.96
Daily SMA5097.47
Daily SMA10097.48
Daily SMA20097.05
Levels
Previous Daily High98.55
Previous Daily Low98.16
Previous Weekly High98.45
Previous Weekly Low97.59
Previous Monthly High98.68
Previous Monthly Low96.28
Daily Fibonacci 38.2%98.4
Daily Fibonacci 61.8%98.31
Daily Pivot Point S198.22
Daily Pivot Point S298
Daily Pivot Point S397.83
Daily Pivot Point R198.61
Daily Pivot Point R298.78
Daily Pivot Point R399

Author

Flavio Tosti

Flavio Tosti

Independent Analyst


More from Flavio Tosti
Share:

Markets move fast. We move first.

Orange Juice Newsletter brings you expert driven insights - not headlines. Every day on your inbox.

By subscribing you agree to our Terms and conditions.

Editor's Picks

EUR/USD climbs toward 1.1800 on broad USD weakness

EUR/USD gathers bullish momentum and advances toward 1.1800 in the second half of the day on Tuesday. The US Dollar weakens and helps the pair stretch higher after the employment report showed that Nonfarm Payrolls declined by 105,000 in October before rising by 64,000 in November.

GBP/USD climbs to fresh two-month high above 1.3400

GBP/USD gains traction in the American session and trades at its highest level since mid-October above 1.3430. The British Pound benefits from upbeat PMI data, while the US Dollar struggles to find demand following the mixed employment figures and weaker-than-forecast PMI prints, allowing the pair to march north.

Gold recovers above $4,300 as markets react to weak US data

Gold trades in positive above $4,300 after spending the first half of the day under bearish pressure. XAU/USD capitalizes on renewed USD weakness after the jobs report showed that the Unemployment Rate climbed to 4.6% in November and the PMI data revealed a loss of growth momentum in the private sector in December. 

US Retail Sales virtually unchanged at $732.6 billion in October

Retail Sales in the United States were virtually unchanged at $732.6 billion in October, the US Census Bureau reported on Tuesday. This print followed the 0.1% increase (revised from 0.3%) recorded in September and came in below the market expectation of +0.1%.

Ukraine-Russia in the spotlight once again

Since the start of the week, gold’s price has moved lower, but has yet to erase the gains made last week. In today’s report we intend to focus on the newest round of peace talks between Russia and Ukraine, whilst noting the release of the US Employment data later on day and end our report with an update in regards to the tensions brewing in Venezuela.

BNB Price Forecast: BNB slips below $855 as bearish on-chain signals and momentum indicators turn negative

BNB, formerly known as Binance Coin, continues to trade down around $855 at the time of writing on Tuesday, after a slight decline the previous day. Bearish sentiment further strengthens as BNB’s on-chain and derivatives data show rising retail activity.