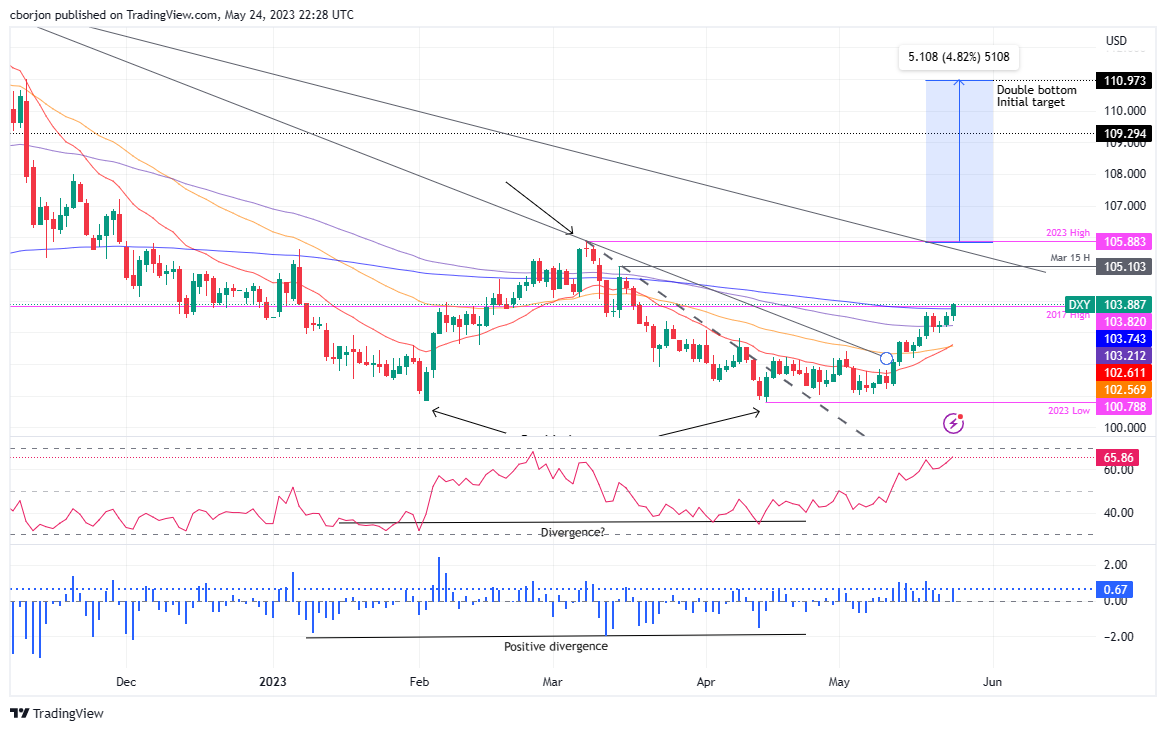
- The US Dollar Index (DXY) gains 0.36%, trading at 103.888, maintaining a rally for three days and surpassing the 200-day EMA.
- DXY must hit 105.883 YTD high to confirm the double-bottom pattern, surpassing multiple resistances.
- Potential risks lie beneath the 200-day EMA; breaking it may lead DXY toward 100-day EMA at 103.212 and May 22's 102.964 low.
The US Dollar Index (DXY), which measures a basket of six currencies against the US Dollar (USD), rallies for three straight days, reclaims the 200-day Exponential Moving Average (EMA) at 103.743 and is also exchanging hands above the 2017 yearly high of 103.820. At the time of writing, the DXY is trading hands at 103.888, gaining 0.36%, with bulls eyeing the 104.000 mark.
US Dollar Index Price Analysis: Technical outlook
From a daily chart perspective, the US Dollar Index is neutral to bullish biased, but it could cement its bias as bullish once the DXY achieves a decisive break above the 200-day EMA. It should be said that the double-bottom that emerged in the weekly chart, as I wrote in a news article on April 14, US Dollar Index: Could a double bottom at the weekly chart drive the DXY to 111.000? remains in play.
However, to validate the double-bottom chart pattern, the DXY must get to the year-to-date (YTD) high of 105.883, though the greenback needs to hurdle some resistance levels on its way up. Meanwhile, the Relative Strength Index (RSI) indicator is in bullish territory, with some room before hitting overbought levels, while the 3-day Rate of Change (RoC) suggests that buyers are gathering momentum.
If the DXY reclaims 104.000, the next resistance level to test would be the March 15 daily high of 105.103. Break above, and the DXY will have a clear run toward testing an eight-month-old resistance trendline around the 105.300-600 area, ahead of piercing the YTD high at 105.883
Downside risks for the DXY remain below the 200-day EMA, which could send the greenback sliding towards the 100-day EMA at 103.212. A clear break will send the DXY toward the May 22 swing low of 102.964, slightly below the 103.000 mark.
US Dollar Index Price Action – Daily chart
Information on these pages contains forward-looking statements that involve risks and uncertainties. Markets and instruments profiled on this page are for informational purposes only and should not in any way come across as a recommendation to buy or sell in these assets. You should do your own thorough research before making any investment decisions. FXStreet does not in any way guarantee that this information is free from mistakes, errors, or material misstatements. It also does not guarantee that this information is of a timely nature. Investing in Open Markets involves a great deal of risk, including the loss of all or a portion of your investment, as well as emotional distress. All risks, losses and costs associated with investing, including total loss of principal, are your responsibility. The views and opinions expressed in this article are those of the authors and do not necessarily reflect the official policy or position of FXStreet nor its advertisers. The author will not be held responsible for information that is found at the end of links posted on this page.
If not otherwise explicitly mentioned in the body of the article, at the time of writing, the author has no position in any stock mentioned in this article and no business relationship with any company mentioned. The author has not received compensation for writing this article, other than from FXStreet.
FXStreet and the author do not provide personalized recommendations. The author makes no representations as to the accuracy, completeness, or suitability of this information. FXStreet and the author will not be liable for any errors, omissions or any losses, injuries or damages arising from this information and its display or use. Errors and omissions excepted.
The author and FXStreet are not registered investment advisors and nothing in this article is intended to be investment advice.
Recommended content
Editors’ Picks

EUR/USD turns lower below 1.0350 after German data
EUR/USD comes under mild selling pressure and eases below 1.0350 in the European session on Wednesday. The pair bears the brunt of an unexpected slowdown in the German manufacturing sector, as the nation's Retail Sales data fail to inspire the Euro. Focus shifts to US ADP data and Fed Minutes.

GBP/USD stays defensive below 1.2500 ahead of key US data, Fed Minutes
GBP/USD stays defensive below 1.2500 in the European trading hours on Wednesday, undermined by a risk-off market sentiment and elevated US Treasury bond yields on increased hawkish Fed bets. Traders look to US data, Fedspeak and FOMC Minutes for fresh trading impulse.

Gold price sticks to modest gains; upside seems limited ahead of FOMC Minutes
Gold price (XAU/USD) sticks to modest intraday gains through the first half of the European session on Wednesday, albeit it lacks bullish conviction and remains below the $2,665 resistance zone retested the previous day.

ADP Employment Change set to show US job growth slowing in December, Fed unlikely to alter plans
The ADP Employment Change will likely have a limited impact on financial markets. The US private sector is expected to have added 139,000 new positions in December.
Five fundamentals for the week: Nonfarm Payrolls to keep traders on edge in first full week of 2025 Premium
Did the US economy enjoy a strong finish to 2024? That is the question in the first full week of trading in 2025. The all-important NFP stand out, but a look at the Federal Reserve and the Chinese economy is also of interest.

Best Forex Brokers with Low Spreads
VERIFIED Low spreads are crucial for reducing trading costs. Explore top Forex brokers offering competitive spreads and high leverage. Compare options for EUR/USD, GBP/USD, USD/JPY, and Gold.