- DXY fails to keep the bounce off April 2018 low.
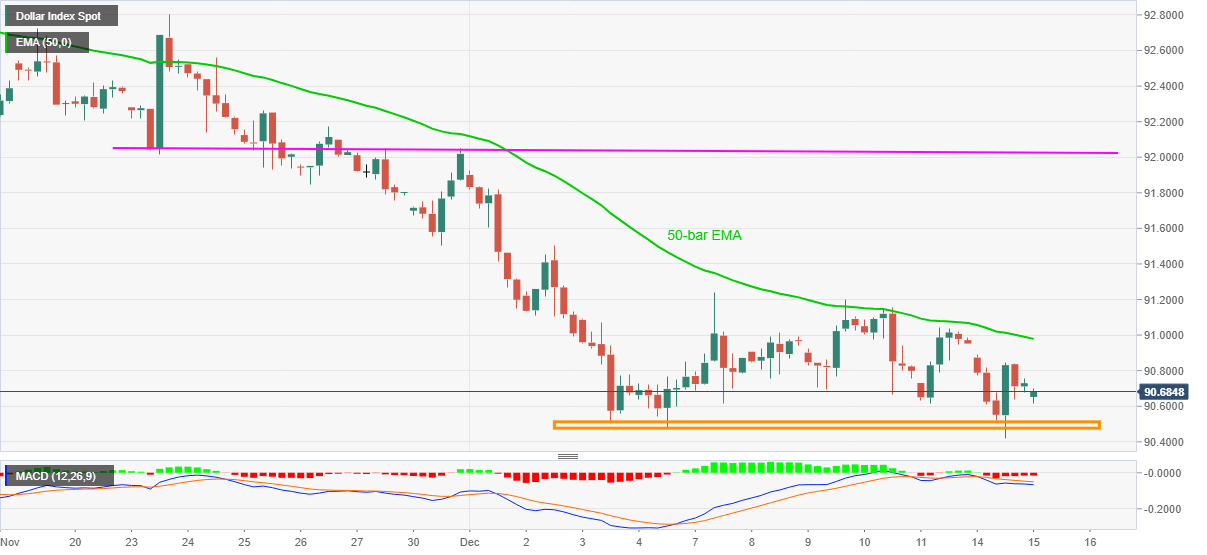
- Bearish MACD, sustained trading below 50-bar EMA favor sellers.
- Bulls can eye three-week-old horizontal resistance above key EMA resistance.
US dollar index (DXY) prints mild losses, currently down 0.06% around 90.67, during the early Tuesday. The greenback gauge dropped to the fresh low since April 2018 before bouncing off 90.42. However, the corrective pullback faded around 90.84.
Not only the inability to recover but sustained trading below 50-bar SMA, amid bearish MACD, joins the eight-day-old rounding top formation on the four-hour (4H) chart to keep the DXY bears hopeful.
While multiple downside barriers around 90.50/45 can challenge the greenback sellers, the 90.00 threshold is likely attracting the offers before the April 2018 monthly bottom close to 89.22.
On the contrary, the recent high of 90.85 can guard the immediate upside of DXY ahead of the 50-day EMA level of 90.97.
The last Wednesday’s top near 91.20 and 91.50 are likely extra hurdles to the north ahead of a short-term horizontal resistance line near 92.03.
DXY four-hour chart
Trend: Bearish
Information on these pages contains forward-looking statements that involve risks and uncertainties. Markets and instruments profiled on this page are for informational purposes only and should not in any way come across as a recommendation to buy or sell in these assets. You should do your own thorough research before making any investment decisions. FXStreet does not in any way guarantee that this information is free from mistakes, errors, or material misstatements. It also does not guarantee that this information is of a timely nature. Investing in Open Markets involves a great deal of risk, including the loss of all or a portion of your investment, as well as emotional distress. All risks, losses and costs associated with investing, including total loss of principal, are your responsibility. The views and opinions expressed in this article are those of the authors and do not necessarily reflect the official policy or position of FXStreet nor its advertisers. The author will not be held responsible for information that is found at the end of links posted on this page.
If not otherwise explicitly mentioned in the body of the article, at the time of writing, the author has no position in any stock mentioned in this article and no business relationship with any company mentioned. The author has not received compensation for writing this article, other than from FXStreet.
FXStreet and the author do not provide personalized recommendations. The author makes no representations as to the accuracy, completeness, or suitability of this information. FXStreet and the author will not be liable for any errors, omissions or any losses, injuries or damages arising from this information and its display or use. Errors and omissions excepted.
The author and FXStreet are not registered investment advisors and nothing in this article is intended to be investment advice.
Recommended content
Editors’ Picks

EUR/USD struggles to hold above 1.1000 after mixed EU data
EUR/USD is having a difficult time stabilizing above 1.1000 in the European session on Monday. The Eurozone Sentix Investor Confidence slumped to -19.5 in April while the annual February Retail Sales jumped 2.3%, limiting the pair's upside despite the broad US Dollar weakness.

GBP/USD reverses below 1.2900 despite US Dollar weakness
GBP/USD fails to sustain the recovery and reverses below 1.2900 in European trading on Monday. The pair shrugs off broad US Dollar weakness as risk sentiment takes a fresh hit, with European traders hitting their desks, weighing on the risk sensitive Pound Sterling.

Gold price holds above $3,000 amid a global meltdown; bulls seem non-committed
Gold price attracts some sellers near the $3,055 support-turned-resistance and stalls its intraday recovery from the $2,972-2,971 area, or a nearly four-week low touched earlier this Monday. Investors continue to unwind their bullish positions to cover losses from a broader meltdown across the global financial markets

Solana Price Forecast: Bears gain momentum as SOL falls below $100
Solana (SOL) extends its loss by over 7% and falls below the $100 mark at the time of writing on Monday after crashing 15.15% last week. Coinglass data shows that SOL’s leveraged traders wiped out nearly $70 million in liquidations in the last 24 hours.

Strategic implications of “Liberation Day”
Liberation Day in the United States came with extremely protectionist and inward-looking tariff policy aimed at just about all U.S. trading partners. In this report, we outline some of the more strategic implications of Liberation Day and developments we will be paying close attention to going forward.

The Best brokers to trade EUR/USD
SPONSORED Discover the top brokers for trading EUR/USD in 2025. Our list features brokers with competitive spreads, fast execution, and powerful platforms. Whether you're a beginner or an expert, find the right partner to navigate the dynamic Forex market.