- A long-term technical analysis of the Dollar Index suggests a sideways trend.
- This is likely to continue until a decisive break above or below the range.
- The index is currently meeting resistance from the 100-week Simple Moving Average.
The US Dollar Index (DXY), which measures the strength of the US Dollar (USD) against a basket of trade-weighted competitors, is in a long-term sideways trend which has lasted for between six months and a year.
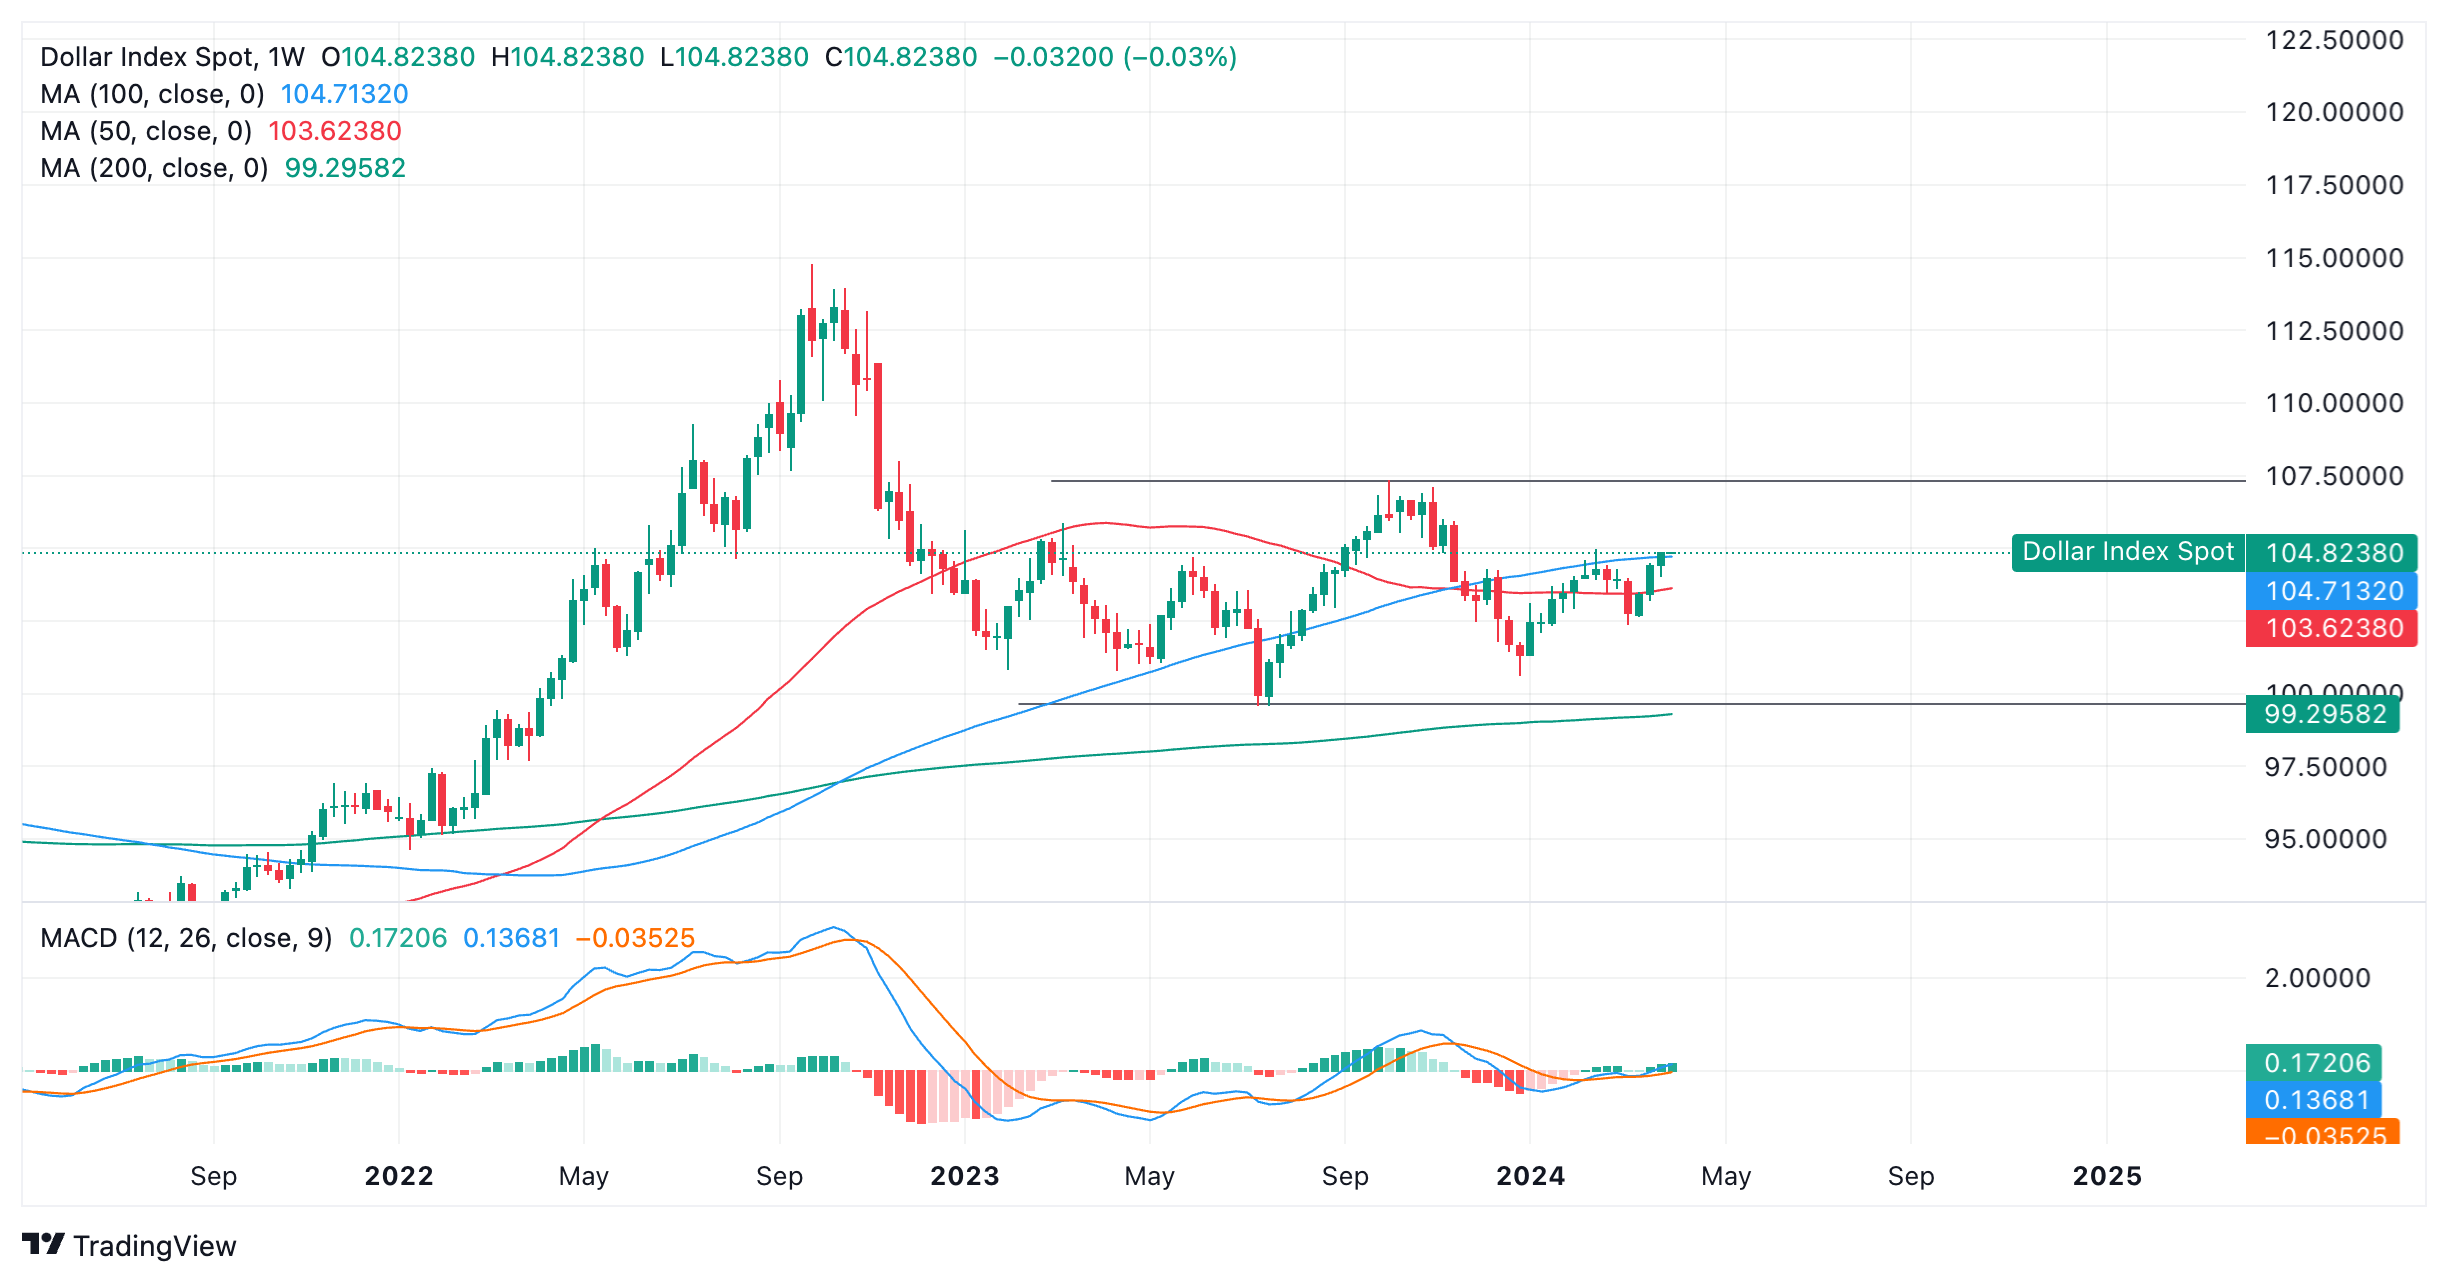
US Dollar Index: Weekly chart
Within its range-locked consolidation, it is currently meeting resistance after rising up to the 100-week Simple Moving Average (SMA) at 104.71.
There is a possibility it could retreat from this substantial barrier. The 50-week SMA sits not far below at around 103.62 and could provide support.
Prior to the formation of the range the Dollar index’s outlook was more bearish. The index reversed sharply at the September 2022 highs and tumbled. The sharpness and depth of the decline suggested the possibility of a major reversal in the trend, however, DXY found support first at 100.00 and then in the 99.00s before reversing and making a recovery.
Since the index found a floor in 2023 it has been oscillating between the aforementioned lows and a top at roughly 107.00.
It would require a decisive break below 99.56 – the July 2023 lows – to indicate bears were back in the driving seat. Such a move would change the trend to bearish and suggest even lower lows were on the horizon.
Alternatively, a decisive break back above 107.00 would tone the chart more bullishly, and suggest a climb back up to the 114.78 high of 2022.
"Decisive" would mean a weekly candle that broke and closed well away from the range high or low, or three consecutive bearish/bullish weeks that ended well away from the range high or low.
Until either materializes, price is seen continuing its sideways trending pattern.
Information on these pages contains forward-looking statements that involve risks and uncertainties. Markets and instruments profiled on this page are for informational purposes only and should not in any way come across as a recommendation to buy or sell in these assets. You should do your own thorough research before making any investment decisions. FXStreet does not in any way guarantee that this information is free from mistakes, errors, or material misstatements. It also does not guarantee that this information is of a timely nature. Investing in Open Markets involves a great deal of risk, including the loss of all or a portion of your investment, as well as emotional distress. All risks, losses and costs associated with investing, including total loss of principal, are your responsibility. The views and opinions expressed in this article are those of the authors and do not necessarily reflect the official policy or position of FXStreet nor its advertisers. The author will not be held responsible for information that is found at the end of links posted on this page.
If not otherwise explicitly mentioned in the body of the article, at the time of writing, the author has no position in any stock mentioned in this article and no business relationship with any company mentioned. The author has not received compensation for writing this article, other than from FXStreet.
FXStreet and the author do not provide personalized recommendations. The author makes no representations as to the accuracy, completeness, or suitability of this information. FXStreet and the author will not be liable for any errors, omissions or any losses, injuries or damages arising from this information and its display or use. Errors and omissions excepted.
The author and FXStreet are not registered investment advisors and nothing in this article is intended to be investment advice.
Recommended content
Editors’ Picks

Gold gives away some gains, slips back to $2,980
Gold retraced from its earlier all-time highs above the key $3,000 mark on Friday, finding a footing around $2,980 per troy ounce. Profit-taking, rising US yields, and a shift to a risk-on environment seem to be putting the brakes on further gains for the metal.

EUR/USD remains firm and near the 1.0900 barrier
EUR/USD is finding its footing and trading comfortably in positive territory as the week wraps up, shaking off two consecutive daily pullbacks and setting its sights back on the pivotal 1.0900 mark—and beyond.

GBP/USD remains depressed, treads water in the low-1.2900s
GBP/USD is holding steady in consolidation territory after Friday’s opening bell on Wall Street, hovering in the low-1.2900 range. This resilience comes despite disappointing UK data and persistent selling pressure on the USD.

Crypto Today: BNB, OKB, BGB tokens rally as BTC, Shiba Inu and Chainlink lead market rebound
Cryptocurrencies sector rose by 0.13% in early European trading on Friday, adding $352 million in aggregate valuation. With BNB, OKB and BGB attracting demand amid intense market volatility, the exchange-based native tokens sector added $1.9 billion.

Week ahead – Central banks in focus amid trade war turmoil
Fed decides on policy amid recession fears. Yen traders lock gaze on BoJ for hike signals. SNB seen cutting interest rates by another 25bps. BoE to stand pat after February’s dovish cut.

The Best brokers to trade EUR/USD
SPONSORED Discover the top brokers for trading EUR/USD in 2025. Our list features brokers with competitive spreads, fast execution, and powerful platforms. Whether you're a beginner or an expert, find the right partner to navigate the dynamic Forex market.