US Dollar Index Price Analysis: Interim top at 110.80?
- DXY corrects lower and drops to multi-session lows.
- The dollar could have charted a near-term top near 110.80.

DXY trades on the defensive for the second session in a row and extends the recent breakdown of the 110.00 mark.
The short-term bullish view in the dollar, however, remains well in place for the time being and so far bolstered by the 7-month support line just below 106.00.
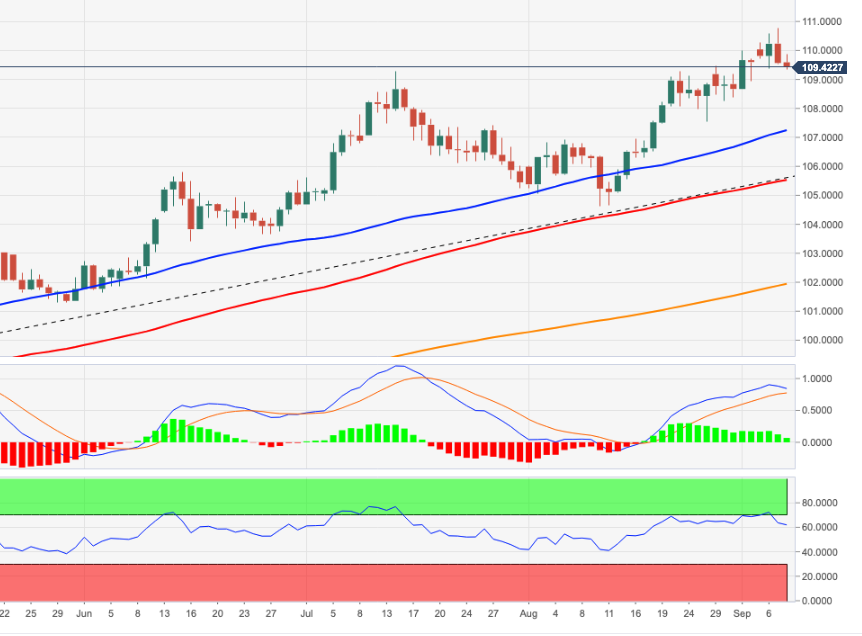
Further retracement in the short-term horizon could leave the recent 20-year high near 110.80 (September 7) as an interim peak. The surpass of this area could open the door to the weekly highs at 111.90 (June 6 2002) and 113.35 (May 24 2002).
Looking at the long-term scenario, the bullish view in the dollar remains in place while above the 200-day SMA at 101.26.
DXY daily chart
Author

Pablo Piovano
FXStreet
Born and bred in Argentina, Pablo has been carrying on with his passion for FX markets and trading since his first college years.


