US Dollar Index Price Analysis: DXY extends bounce off nearby support line to tease 90.00
- DXY pauses around short-term key support line after two-day downtrend.
- Bearish MACD, failure to cross 200-SMA favor sellers.
- 61.8% FE gains market attention below the fortnight-old immediate support.

US dollar index (DXY) fades the late Monday’s corrective pullback around the 90.00 threshold during early Tuesday’s trading. Even so, the greenback gauge versus the major six currencies probes the bears after consecutive two-day declines in the recent past.
Given the bearish MACD and failures to cross the 200-SMA, the US dollar index is likely to break the stated support line, around 89.90.
Though, any further downside will have multiple barriers near 89.70 and 89.50 before the DXY sellers could attack 61.8% Fibonacci Expansion (FE) of April 16 to May 25 downtrend, around 89.20.
Alternatively, further recovery will eye for the 90.30 resistance before confronting the 200-SMA level of 90.41. Also acting as an upside filter is the monthly peak surrounding 90.62.
In a case wherein the DXY buyers refresh the monthly top, the mid-May high near the 91.00 and multiple tops marked since late April surrounding 91.45 will gain the market’s attention.
DXY four-hour chart
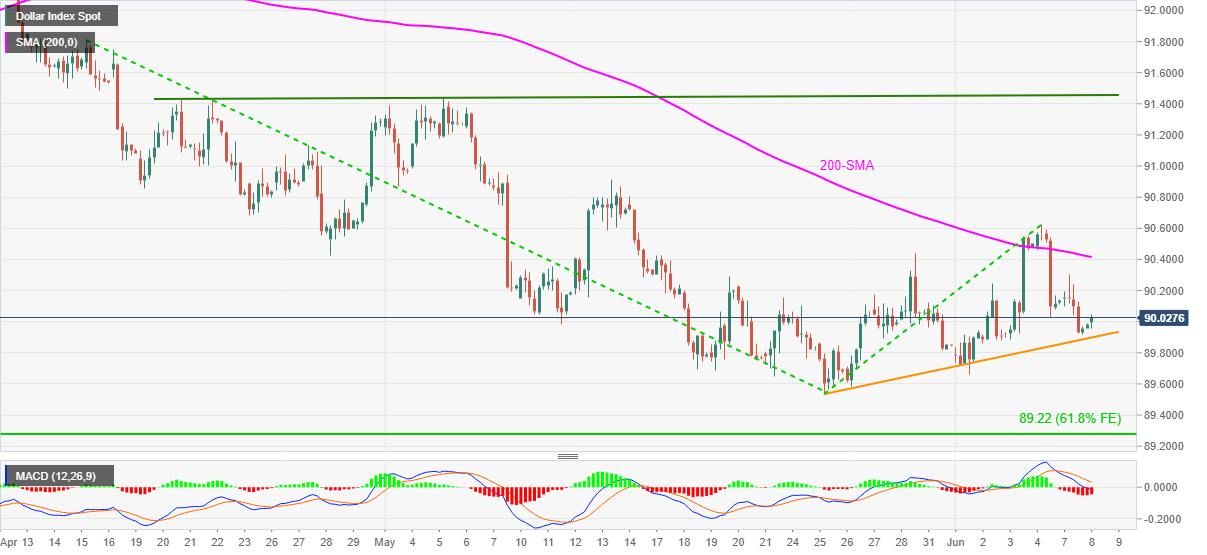
Trend: Bearish
Author

Anil Panchal
FXStreet
Anil Panchal has nearly 15 years of experience in tracking financial markets. With a keen interest in macroeconomics, Anil aptly tracks global news/updates and stays well-informed about the global financial moves and their implications.


