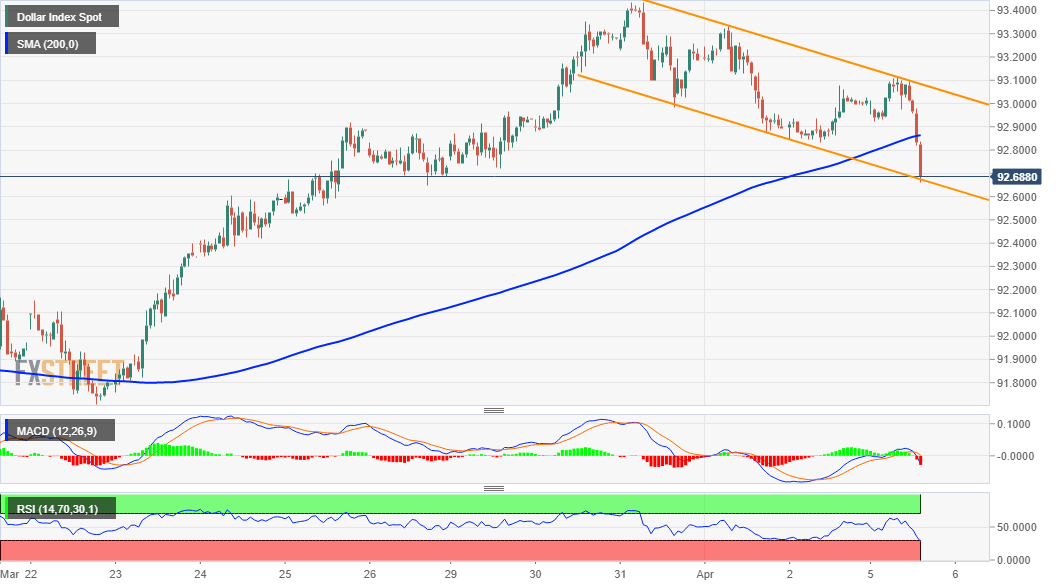
- The prevalent risk-on mood dragged DXY to one-week lows on the first day of the week.
- The slide along a descending trend channel constitutes the formation of a bullish flag.
- Bullish oscillators on the daily chart further add credence to the constructive setup.
The US Dollar Index (DXY) maintained its offered tone through the early North American session and dropped to one-week lows, around the 92.70-65 region in the last hour.
As investors looked past Friday's blockbuster US NFP report, the prevalent risk-on mood was seen as a key factor undermining the safe-haven greenback. Even a modest uptick in the US Treasury bond yields, upbeat US PMI prints failed to impress the USD bulls, albeit the upbeat US economic outlook should help limit any further losses.
Looking at the technical picture, the recent pullback from multi-month tops has been along a downward sloping channel. Given that the DXY has now slipped below 200-hour SMA, the intraday bias seems tilted in favour of bearish traders. The negative outlook is reinforced by bearish technical indicators on hourly charts.
That said, the mentioned channel constitutes the formation of a bullish flag pattern. Moreover, oscillators on the daily chart – though have been retreating from higher levels – are still holding comfortably in the bullish territory. Hence, any subsequent fall might still be seen as a buying opportunity.
Meanwhile, the lower boundary of the mentioned channel coincides with the 23.6% Fibonacci level of the 103.00-89.21 downfall. This, in turn, should now act as a strong base for the DXY, which if broken decisively will set the stage for additional losses towards testing the very important 200-day SMA, around mid-92.00s.
On the flip side, the 92.85-90 region (200-hour SMA) now seems to act as immediate resistance. This is followed by the top boundary of the descending channel, currently near the 93.10 region. A convincing breakthrough will confirm a bullish breakout and push the DXY back towards multi-month tops, around the 93.45-50 region.
DXY 1-hour chart
Technical levels to watch
Information on these pages contains forward-looking statements that involve risks and uncertainties. Markets and instruments profiled on this page are for informational purposes only and should not in any way come across as a recommendation to buy or sell in these assets. You should do your own thorough research before making any investment decisions. FXStreet does not in any way guarantee that this information is free from mistakes, errors, or material misstatements. It also does not guarantee that this information is of a timely nature. Investing in Open Markets involves a great deal of risk, including the loss of all or a portion of your investment, as well as emotional distress. All risks, losses and costs associated with investing, including total loss of principal, are your responsibility. The views and opinions expressed in this article are those of the authors and do not necessarily reflect the official policy or position of FXStreet nor its advertisers. The author will not be held responsible for information that is found at the end of links posted on this page.
If not otherwise explicitly mentioned in the body of the article, at the time of writing, the author has no position in any stock mentioned in this article and no business relationship with any company mentioned. The author has not received compensation for writing this article, other than from FXStreet.
FXStreet and the author do not provide personalized recommendations. The author makes no representations as to the accuracy, completeness, or suitability of this information. FXStreet and the author will not be liable for any errors, omissions or any losses, injuries or damages arising from this information and its display or use. Errors and omissions excepted.
The author and FXStreet are not registered investment advisors and nothing in this article is intended to be investment advice.
Recommended content
Editors’ Picks

EUR/USD struggles to hold above 1.0550, eyes on German inflation data
EUR/USD stays on the back foot and trades in negative territory slightly below 1.0550 on Thursday. Soft regional inflation data from Germany seems to be weighing on the Euro as investors await nation-wide Consumer Price Index figures.

GBP/USD trades below 1.2700 on modest USD recovery
GBP/USD stays under modest bearish pressure and fluctuates below 1.2700 on Thursday. The US Dollar corrects higher following Wednesday's sharp decline, making it difficult for the pair to continue to push higher. US markets will remain close on Thanksgiving Day.

Gold clings to small daily gains near $2,650
Gold (XAU/USD) reverses an intraday dip to the $2,620 area and trades near $2,650 on Thursday, albeit it lacks bullish conviction. Investors remain concerned that US President-elect Donald Trump's tariff plans will impact the global economic outlook.

Fantom bulls eye yearly high as BTC rebounds
Fantom (FTM) continued its rally and rallied 8% until Thursday, trading above $1.09 after 43% gains in the previous week. Like FTM, most altcoins have continued the rally as Bitcoin (BTC) recovers from its recent pullback this week.

Eurozone PMI sounds the alarm about growth once more
The composite PMI dropped from 50 to 48.1, once more stressing growth concerns for the eurozone. Hard data has actually come in better than expected recently – so ahead of the December meeting, the ECB has to figure out whether this is the PMI crying wolf or whether it should take this signal seriously. We think it’s the latter.

Best Forex Brokers with Low Spreads
VERIFIED Low spreads are crucial for reducing trading costs. Explore top Forex brokers offering competitive spreads and high leverage. Compare options for EUR/USD, GBP/USD, USD/JPY, and Gold.
