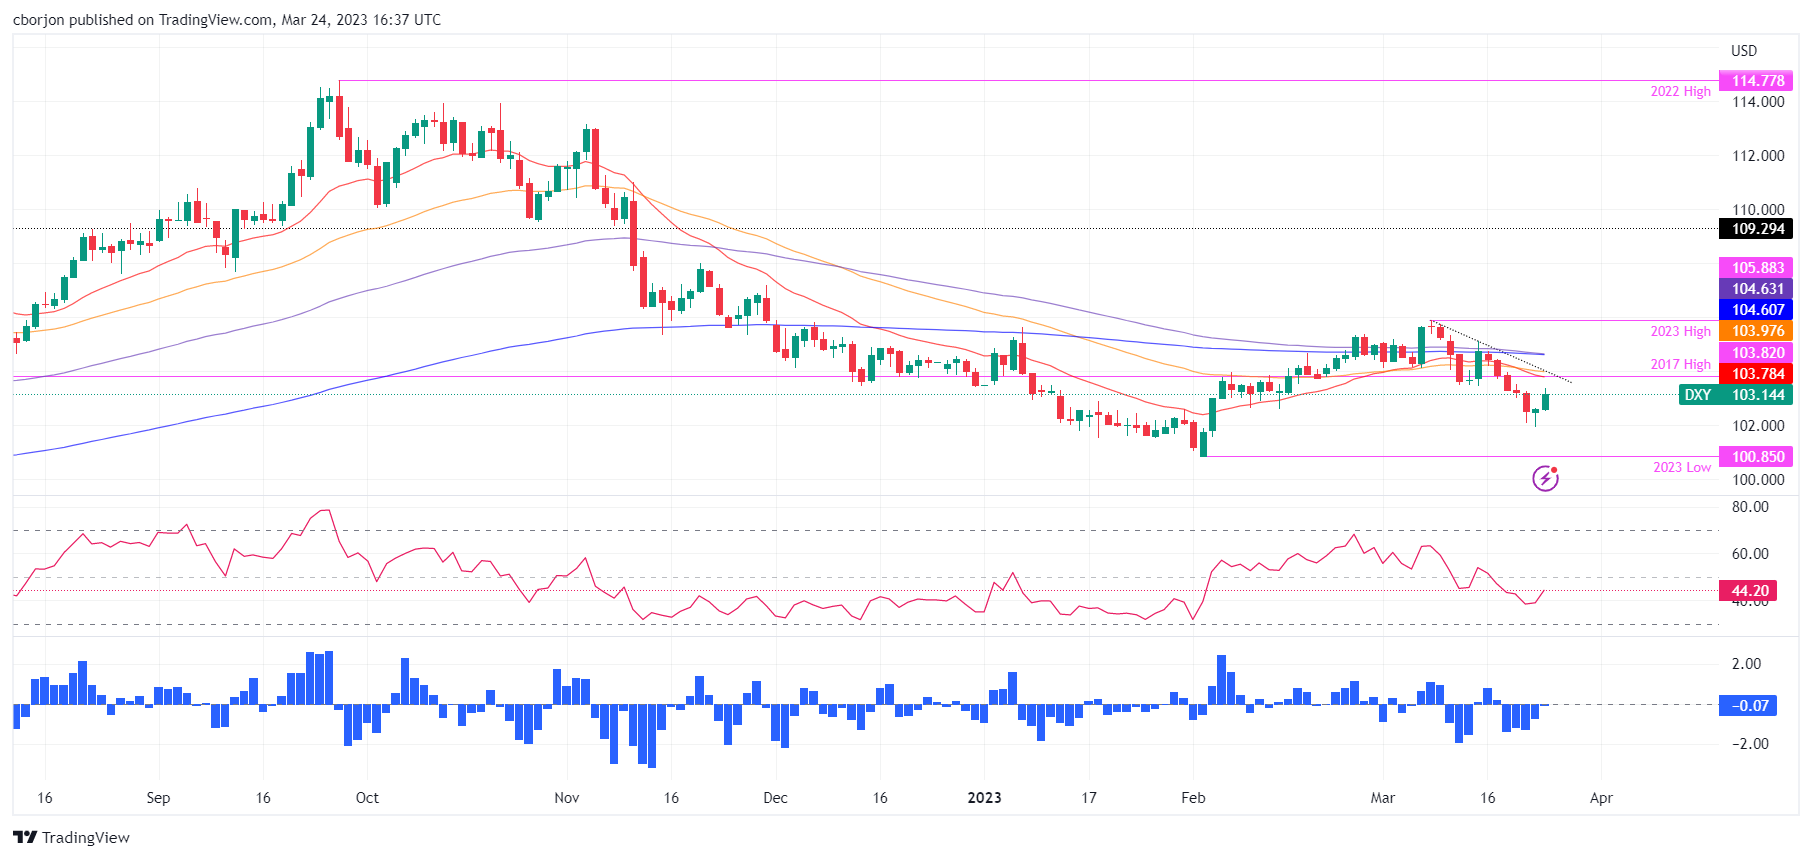
- The US Dollar Index advances for two days, forming a “morning star” candle chart pattern.
- Oscillators paint a mixed picture, though RSI could be turning bullish.
- A daily close above 103.26 will pave the DXY’s way to test 104.00
The US Dollar Index (DXY), which tracks a basket of six currencies against the US Dollar (USD), advances 1.58% after hitting a 7-week low of 101.91. At the time of writing, the DXY is trading at 103.12 after hitting a daily low of 102.50.
US Dollar Index Price action
From a daily chart perspective, the DXY is neutrally biased, as it remains above the 2023 low of 100.85. In addition, the US Dollar Index pierced the last higher-high (HH) of 105.63 and printed a YTD high at 105.88. In addition, a candlestick chart pattern, “morning star,” it’s forming, which could pave the way to test the daily Exponential Moving Averages (EMAs) sitting at around 103.782.
For a bullish resumption, the DXY must achieve a daily close above the March 22 high at 103.26. Once done, the DXY could test the confluence of the 20-day EMA and 2017 high at 103.78. If that strong resistance area is broken, the 50-day EMA at 103.97 is up for grabs, ahead of 104.00.
Otherwise, buying weakness could mean that the ongoing leg-up is a correction of a continued downtrend. That said, the US Dollar Index’s first support would be 103.00. A breach of the latter will expose the March 23 swing low at 101.91, followed by the YTD low at 100.85.
Oscillators, like the Relative Strength Index (RSI), are tracking the trend, though it remains bearish. Contrarily, the Rate of Change (RoC) shows that sellers’ momentum is waning, about to turn neutral.
US Dollar Index Daily chart
US Dollar Index Technical levels
Information on these pages contains forward-looking statements that involve risks and uncertainties. Markets and instruments profiled on this page are for informational purposes only and should not in any way come across as a recommendation to buy or sell in these assets. You should do your own thorough research before making any investment decisions. FXStreet does not in any way guarantee that this information is free from mistakes, errors, or material misstatements. It also does not guarantee that this information is of a timely nature. Investing in Open Markets involves a great deal of risk, including the loss of all or a portion of your investment, as well as emotional distress. All risks, losses and costs associated with investing, including total loss of principal, are your responsibility. The views and opinions expressed in this article are those of the authors and do not necessarily reflect the official policy or position of FXStreet nor its advertisers. The author will not be held responsible for information that is found at the end of links posted on this page.
If not otherwise explicitly mentioned in the body of the article, at the time of writing, the author has no position in any stock mentioned in this article and no business relationship with any company mentioned. The author has not received compensation for writing this article, other than from FXStreet.
FXStreet and the author do not provide personalized recommendations. The author makes no representations as to the accuracy, completeness, or suitability of this information. FXStreet and the author will not be liable for any errors, omissions or any losses, injuries or damages arising from this information and its display or use. Errors and omissions excepted.
The author and FXStreet are not registered investment advisors and nothing in this article is intended to be investment advice.
Recommended content
Editors’ Picks

EUR/USD struggles to reclaim 1.0800 after German sentiment data
EUR/USD fluctuates in a tight channel slightly below 1.0800 in the European session on Tuesday. The data from Germany showed that the IFO - Business Climate improved less than expected in March. In the second half of the day, consumer sentiment data from the US will be watched closely.

GBP/USD trades with caution above 1.2900, with eyes on tariffs, geopolitics
GBP/USD treads water above 1.2900 in Tuesday’s European session. The pair struggles amid a downbeat market mood as trades turn cautious amid a lack of clarity on US tariffs, anticipating the outcome of the US-Rusisa talks on Ukraine peace deal. US data and Fedspeak are also in focus.

Gold price trades with modest gains above $3,000; positive risk tone could cap gains
Gold price edges higher and snaps a three-day losing streak amid a softer USD. Bets that the Fed will resume its rate-cutting cycle soon also support the bullion. Traders now look to Tuesday’s US macro data and Fed speak for a fresh impetus.

Cronos rallies 17% ahead of its zkEVM v26 Mainnet upgrade
Cronos, the token for the Crypto.com platform, extends its gain by 17% and trades around $0.11 on Monday after surging nearly 18% the previous day.

Seven Fundamentals for the Week: Tariff news, fresh surveys, the Fed's preferred inflation gauge are eyed Premium
Reports and rumors ahead of Trump’s reciprocal tariffs announcement next week will continue moving markets. Business and consumer surveys will try to gauge where the US economy is heading. Core PCE, the Fed's preferred inflation gauge, is eyed late in the week.

The Best brokers to trade EUR/USD
SPONSORED Discover the top brokers for trading EUR/USD in 2025. Our list features brokers with competitive spreads, fast execution, and powerful platforms. Whether you're a beginner or an expert, find the right partner to navigate the dynamic Forex market.