- DXY picks up bids following its bounce off two-week-old support line, 21-day SMA.
- 12-week-old resistance line, 50-day SMA guard immediate upside.
- RSI conditions suggest continuation of sideways moves.
- Fed expected to unveil dovish halt during the first FOMC of 2021.
US dollar index (DXY) extends recovery moves while picking up the bids to 90.22 during early Wednesday. The greenback gauge stepped back from a downward sloping trend line from November 02 the previous day. Though, 21-day SMA and a short-term ascending support line restricted further declines.
Although the latest bounce off key support confluence, coupled with the normal RSI line, favor the extension of the corrective pullback, the key resistance line and 50-day SMA challenge the DXY bulls.
As a result, the quote’s current upside momentum eyeing the stated resistance line, at 90.54 now, may fade if fail to cross the 50-day SMA level of 90.65.
On the contrary, the fresh downside will have to break below the 90.13 support confluence and 90.00 round-figure to recall the US dollar bears.
While RSI seems to be failing to provide any clear direction, DXY moves are likely to take clues from today’s US Federal Open Market Committee (FOMC) meeting. Should the Fed announce a dovish halt, as expected, the quote is likely to break the key support while an upbeat statement from the US central bank, if any, needs validation from stimulus and vaccine headlines to please the bulls.
Read: Fed Preview: Fearing market froth or boosting Biden's stimulus? Three scenarios
DXY daily chart
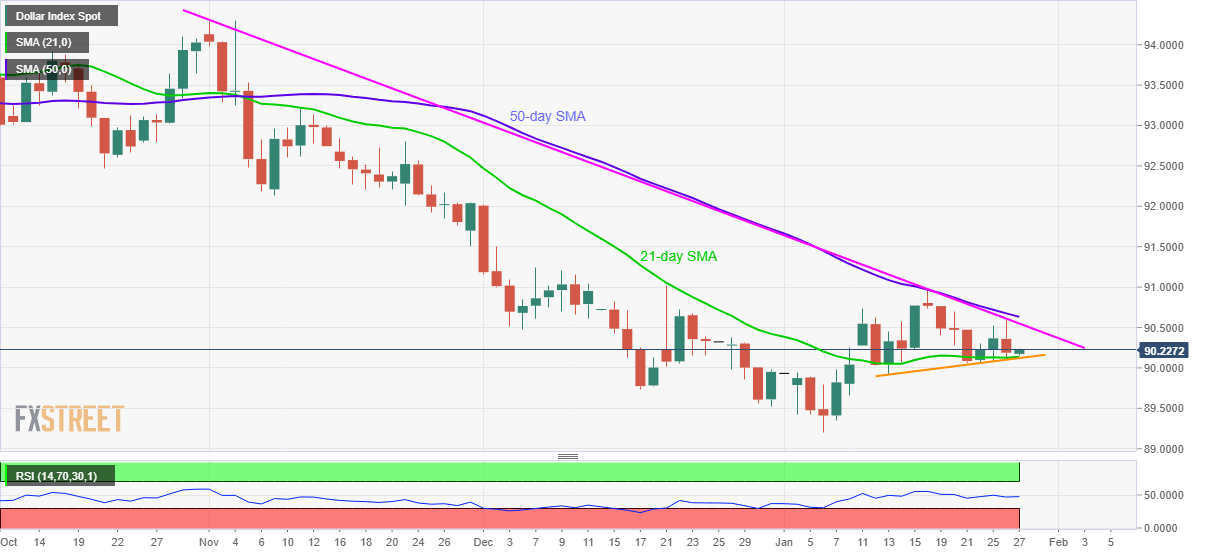
Trend: Sideways
Information on these pages contains forward-looking statements that involve risks and uncertainties. Markets and instruments profiled on this page are for informational purposes only and should not in any way come across as a recommendation to buy or sell in these assets. You should do your own thorough research before making any investment decisions. FXStreet does not in any way guarantee that this information is free from mistakes, errors, or material misstatements. It also does not guarantee that this information is of a timely nature. Investing in Open Markets involves a great deal of risk, including the loss of all or a portion of your investment, as well as emotional distress. All risks, losses and costs associated with investing, including total loss of principal, are your responsibility. The views and opinions expressed in this article are those of the authors and do not necessarily reflect the official policy or position of FXStreet nor its advertisers. The author will not be held responsible for information that is found at the end of links posted on this page.
If not otherwise explicitly mentioned in the body of the article, at the time of writing, the author has no position in any stock mentioned in this article and no business relationship with any company mentioned. The author has not received compensation for writing this article, other than from FXStreet.
FXStreet and the author do not provide personalized recommendations. The author makes no representations as to the accuracy, completeness, or suitability of this information. FXStreet and the author will not be liable for any errors, omissions or any losses, injuries or damages arising from this information and its display or use. Errors and omissions excepted.
The author and FXStreet are not registered investment advisors and nothing in this article is intended to be investment advice.


Recommended content
Editors’ Picks

EUR/USD trims losses and approaches 1.1380
The US Dollar now succumbs to the re-emergence of the selling pressure and allows EUR/USD to recoup part of the ground lost and approach to the 1.1380 zone on Thursday. Earlier on Thursday, the ECB matched estimates and lowered its rates by 25 bps.

GBP/USD extends the daily recovery, looks at 1.3300
The upside impulse in the British pound remains everything but abated and now propels GBP/USD to the upper end of the range, shifting its attention to recent yearly peaks near 1.3300 the figure.

Gold breaks below $3,300, daily troughs
Further improvement in the sentiment surrounding the risk-associated universe put Gold prices to the test on Thursday. Indeed, the troy ounce of the precious metal faces increasing downside pressure and breaches the key $3,300 mark to hit new daily lows.

Crypto market cap fell more than 18% in Q1, wiping out $633.5 billion after Trump’s inauguration top
CoinGecko’s Q1 Crypto Industry Report highlights that the total crypto market capitalization fell by 18.6% in the first quarter, wiping out $633.5 billion after topping on January 18, just a couple of days ahead of US President Donald Trump’s inauguration.

Future-proofing portfolios: A playbook for tariff and recession risks
It does seem like we will be talking tariffs for a while. And if tariffs stay — in some shape or form — even after negotiations, we’ll likely be talking about recession too. Higher input costs, persistent inflation, and tighter monetary policy are already weighing on global growth.

The Best brokers to trade EUR/USD
SPONSORED Discover the top brokers for trading EUR/USD in 2025. Our list features brokers with competitive spreads, fast execution, and powerful platforms. Whether you're a beginner or an expert, find the right partner to navigate the dynamic Forex market.