|

US Dollar Index (DXY) Price Analysis: Slips below 92.00 to refresh 28-month low

  • US Dollar Index refreshes the multi-month low even as RSI turns oversold.
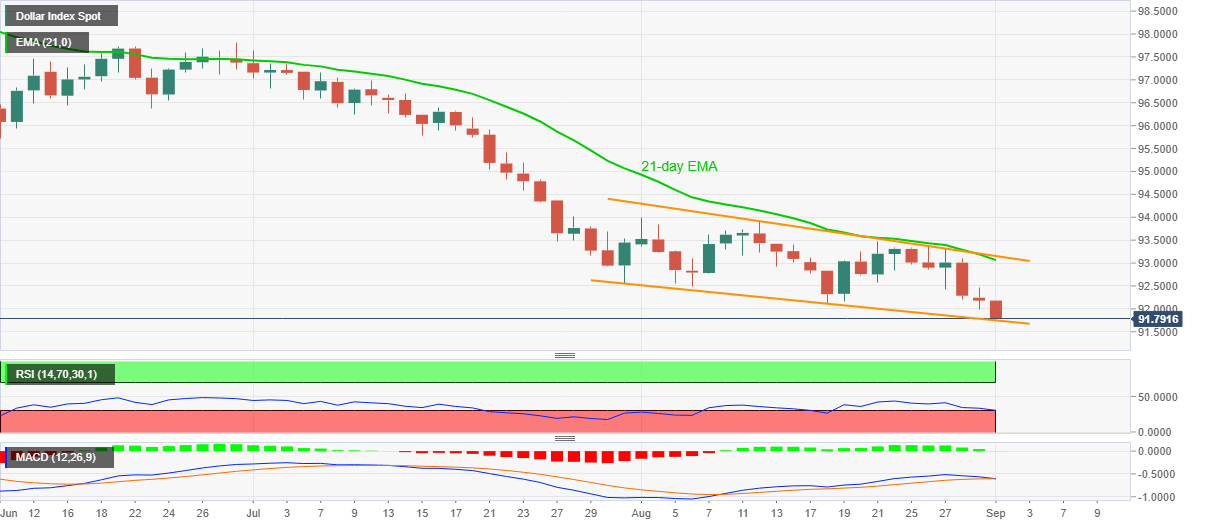
  • Support-line of a one-month-old falling channel can trigger a pullback.
  • 21-day EMA, channel’s resistance line keep the buyers away.

US dollar index (DXY) bears dominate near the lowest since May 2018 while taking offers around 91.77 during the early Tuesday. The greenback gauge keeps extending its south-run while ignoring the oversold conditions of the RSI.

As a result, the US currency index’s bounce off the support line of a falling trend channel since July 31, at 91.74 now, gains more acceptance.

However, the MACD histogram is still flirting with the bears and may drag the quote towards September 2017 bottom close to 91.00 in a case the quote drops below 91.74.

Meanwhile, the August 06 low around 92.50 can entertain the short-term buyers during the pullback moves. Though, a 21-day EMA level of 93.06 and resistance line of the mentioned channel close to 93.15 can restrict the bounce.

It’s worth mentioning that the bulls targeting the previous month’s top near 93.90 are less likely to return unless the DXY closes past-93.15.

DXY daily chart

Trend: Pullback expected

Additional important levels

Overview
Today last price91.83
Today Daily Change-0.35
Today Daily Change %-0.38%
Today daily open92.18
 
Trends
Daily SMA2093.01
Daily SMA5094.72
Daily SMA10096.78
Daily SMA20097.52
 
Levels
Previous Daily High92.48
Previous Daily Low92
Previous Weekly High93.36
Previous Weekly Low92.2
Previous Monthly High94
Previous Monthly Low92
Daily Fibonacci 38.2%92.18
Daily Fibonacci 61.8%92.29
Daily Pivot Point S191.96
Daily Pivot Point S291.74
Daily Pivot Point S391.48
Daily Pivot Point R192.43
Daily Pivot Point R292.69
Daily Pivot Point R392.91

Author

Anil Panchal

Anil Panchal

FXStreet

Anil Panchal has nearly 15 years of experience in tracking financial markets. With a keen interest in macroeconomics, Anil aptly tracks global news/updates and stays well-informed about the global financial moves and their implications.

More from Anil Panchal
Share:

Editor's Picks

EUR/USD holds above 1.1750 after mixed PMI data

EUR/USD manages to hold above 1.1750 but struggles to gather recovery momentum on Friday, following the mixed February PMI figures from Germany and the Eurozone. In the second half of the day, Q4 GDP, December inflation and February PMI data from the US will be watched closely by market participants.

GBP/USD recovers above 1.3450 ahead of UK PMI data

GBP/USD is recovering ground above 1.3450 in European trading on Friday, helped by a modest uptick in the Pound Sterling after a bigger-than-expected increase in the UK Retail Sales for January. However, the further upside appears limited in the pair amid persistent US Dollar strength and ahead of key UK and US data. 

Gold rises for third day on geopolitical risks, US data eyed

Gold gains some positive traction for the third consecutive day on Friday. The upside potential, however, seems limited amid the mixed fundamental backdrop. Moreover, traders might opt to wait for the key US macro releases – the Advance Q4 GDP report and the Personal Consumption Expenditures (PCE) Price Index – before placing fresh directional bets.

US GDP growth expected to slow down significantly in Q4 after stellar Q3 

The United States Bureau of Economic Analysis will publish the first preliminary estimate of the fourth-quarter Gross Domestic Product at 13:30 GMT. Analysts forecast the US economy to have expanded at a 3% annualized rate, slowing down from the 4.4% growth posted in the previous quarter.

Hawkish Fed minutes and a market finding its footing

It was green across the board for US Stock market indexes at the close on Wednesday, with most S&P 500 names ending higher, adding 38 points (0.6%) to 6,881 overall. At the GICS sector level, energy led gains, followed by technology and consumer discretionary, while utilities and real estate posted the largest losses.

Official Trump price approaches breakout with mixed signals from traders

Official Trump (TRUMP) is trading at $3.50 at the time of writing, approaching its upper consolidation range. A breakout from this range could open the door for an upside move. On-chain data shows market indecision, with balanced flows between bulls and bears, signaling a lack of clear directional bias.