|

US Dollar Index: Could a double bottom at the weekly chart drive the DXY to 111.000?

  • The US Dollar Index found bids at around the YTD lows at 100.788.
  • USD bulls must retake 104.000 to challenge YTD high at 105.883 and maintain a double-bottom approach.
  • Contrarily, USD bears must reclaim 100.788 to test the 200-week EMA at around 99.117.

The US Dollar Index (DXY), a basket of six currencies against a basket of peers, snaps three days of straight losses and climbs 0.56% as the New York session ends. At the time of writing, the DXY exchanges hand at 101.570 as a bullish engulfing candle pattern emerges in the daily chart.

US Dollar Index Price Action

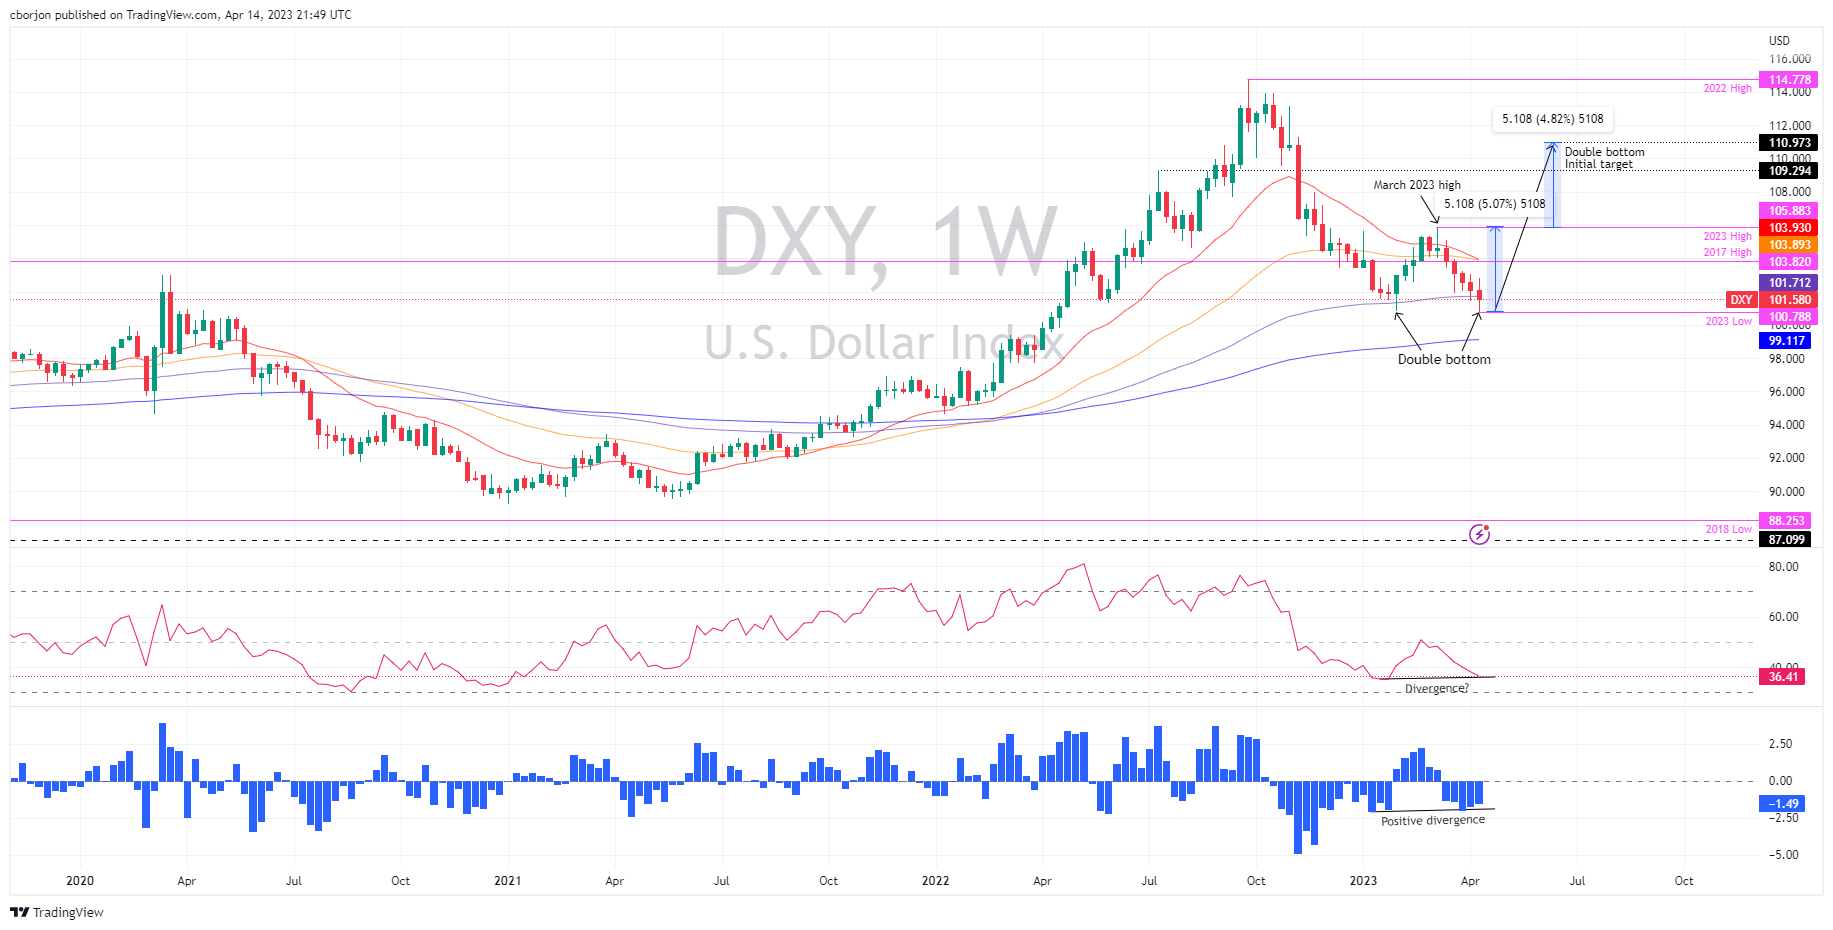
From a weekly chart perspective, the US Dollar Index remains upward biased. The DXY’s fall from around September 2022 highs at 114.728 towards 2023 lows of 100.788 bottomed around the latter, depicting a double bottom formation. Furthermore, the 200-week Exponential Moving Average (EMA) sits comfortably at around 99.117. The Relative Strength Index (RSI) is in bearish territory, but in the recent dip, the RSI is bottoming higher than the prior’s through. The Rate of Change (RoC) also displays that selling pressure is waning, which could pave the way for further upside.

Upside risks in the DXY lie at the confluence of the 50 and 20-week EMAs, around 103.893-103.930. The break above will expose the 2023 high at 105.883, the last peak, before clearing the way toward 111.000, the double-bottom initial target.

Conversely, the US Dollar Index’s first support would be 100.788. A dip below, and nothing would be in the way toward the 200-week EMA at 99.117.

US Dollar Index Weekly Chart

US Dollar Index Weekly Chart

USD Dollar Index Technical Levels

Dollar Index Spot

Overview
Today last price101.58
Today Daily Change0.56
Today Daily Change %0.55
Today daily open101.02
 
Trends
Daily SMA20102.41
Daily SMA50103.49
Daily SMA100103.57
Daily SMA200106.4
 
Levels
Previous Daily High101.6
Previous Daily Low100.85
Previous Weekly High103.06
Previous Weekly Low101.41
Previous Monthly High105.89
Previous Monthly Low101.92
Daily Fibonacci 38.2%101.14
Daily Fibonacci 61.8%101.31
Daily Pivot Point S1100.71
Daily Pivot Point S2100.4
Daily Pivot Point S399.96
Daily Pivot Point R1101.46
Daily Pivot Point R2101.9
Daily Pivot Point R3102.21

Author

Christian Borjon Valencia

Christian Borjon began his career as a retail trader in 2010, mainly focused on technical analysis and strategies around it. He started as a swing trader, as he used to work in another industry unrelated to the financial markets.

More from Christian Borjon Valencia
Share:

Markets move fast. We move first.

Orange Juice Newsletter brings you expert driven insights - not headlines. Every day on your inbox.

By subscribing you agree to our Terms and conditions.

Editor's Picks

EUR/USD clings to small gains near 1.1750

Following a short-lasting correction in the early European session, EUR/USD regains its traction and clings to moderate gains at around 1.1750 on Monday. Nevertheless, the pair's volatility remains low, with investors awaiting this weeks key US data releases and the ECB policy announcements.

GBP/USD edges higher toward 1.3400 as traders await key data and BoE

GBP/USD reverses its direction and advances toward 1.3400 following a drop to the 1.3350 area earlier in the day. The US Dollar struggles to gather recovery momentum as markets await Tuesday's Nonfarm Payrolls data, while the Pound Sterling holds steady ahead of the BoE policy announcements later in the week.

Gold builds on previous week's gains, approaches $4,350

Gold preserves its bullish momentum after rising more than 2% last week and climbs toward $4,350 on Monday. The precious metal extends its upside as the US Dollar remains on the back foot on growing expectations for a dovish Fed policy outlook next year.

Solana consolidates as spot ETF inflows near $1 billion signal institutional dip-buying

Solana price hovers above $131 at the time of writing on Monday, nearing the upper boundary of a falling wedge pattern, awaiting a decisive breakout. On the institutional side, demand for spot Solana Exchange-Traded Funds remained firm, pushing total assets under management to nearly $1 billion since launch. 

Big week ends with big doubts

The S&P 500 continued to push higher yesterday as the US 2-year yield wavered around the 3.50% mark following a Federal Reserve (Fed) rate cut earlier this week that was ultimately perceived as not that hawkish after all. The cut is especially boosting the non-tech pockets of the market.

Solana Price Forecast: SOL consolidates as spot ETF inflows near $1 billion signal institutional dip-buying

Solana (SOL) price hovers above $131 at the time of writing on Monday, nearing the upper boundary of a falling wedge pattern, awaiting a decisive breakout.