|

US Dollar Index Asia Price Forecast: DXY shoots to 3-year’s high, above 100.00 figure

  • DXY surges to highest since February 2017 on de-leveraging. 
  • The level to beat for bulls is the 102.00 figure. 
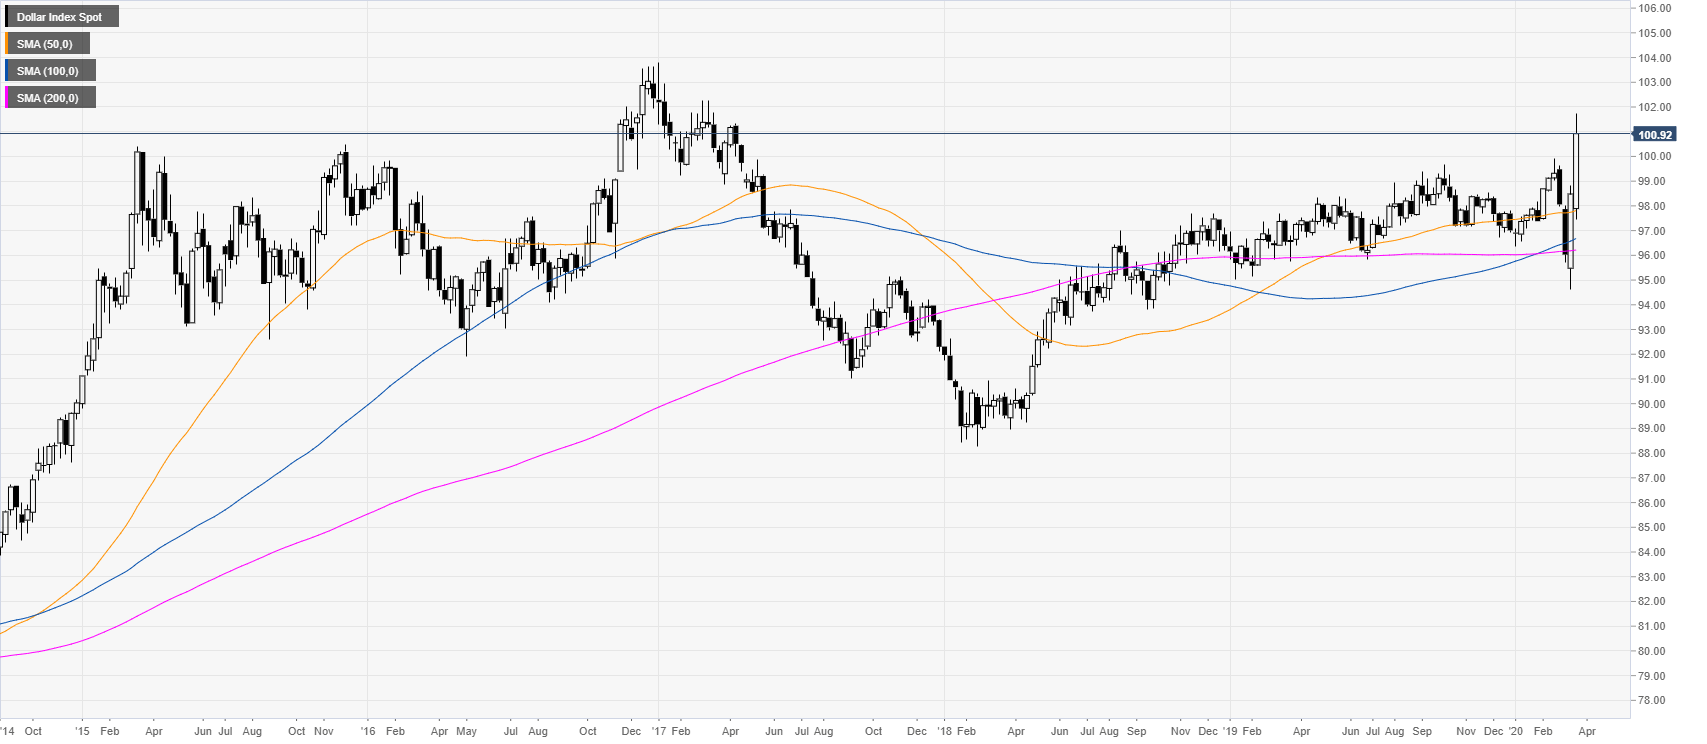
 

DXY weekly chart

 
DXY (US dollar index) is trading at its highest since March 2017 as the greenback is benefitting from an exceptional buying wave as massive de-leveraging is triggering a run into the US dollar.
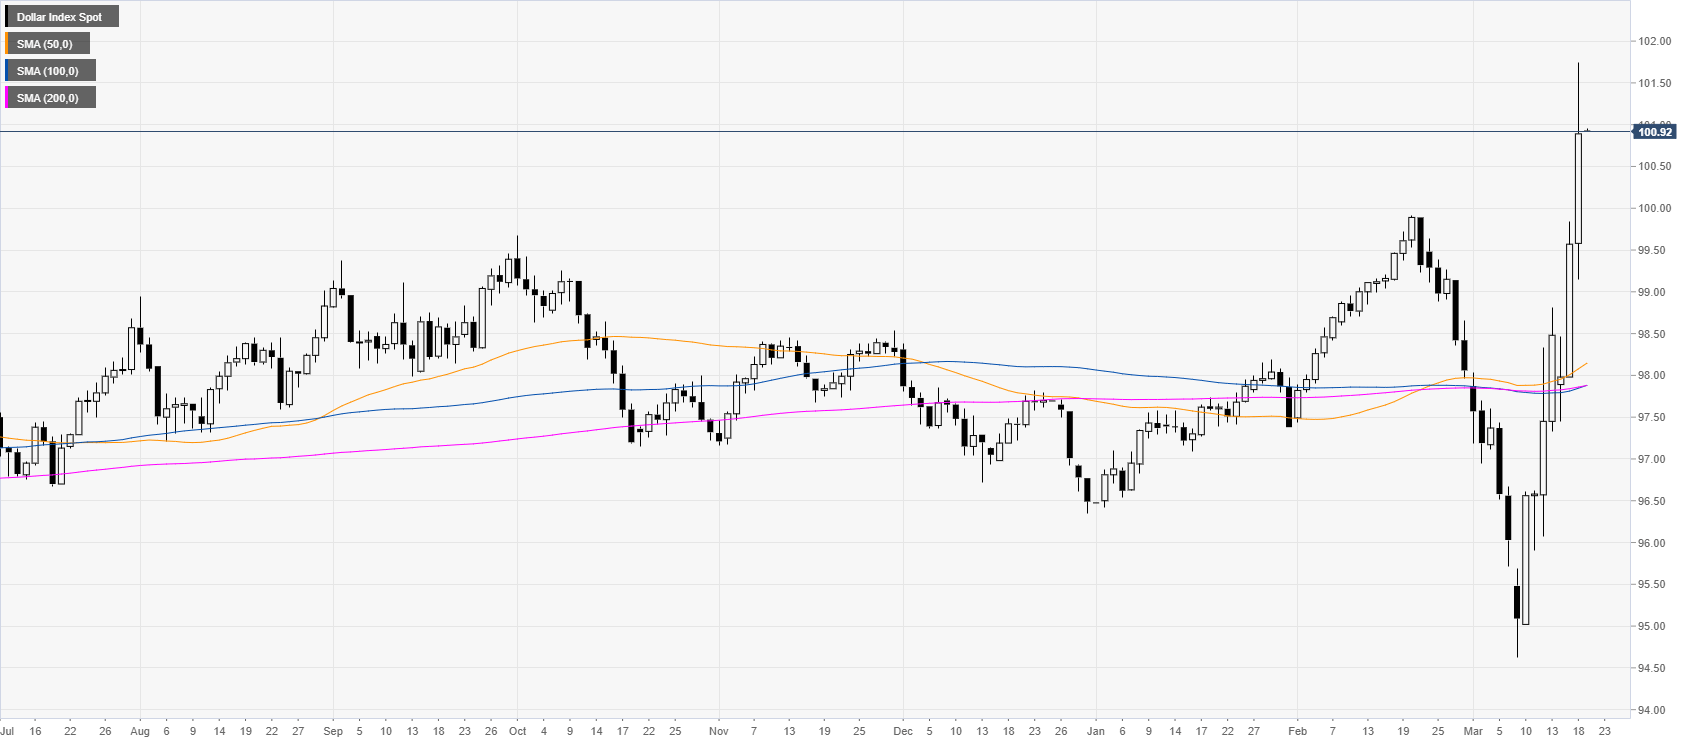
 

DXY daily chart

 
Only two weeks back, DXY sold off which was then followed by the best weekly advance since October 2008. 
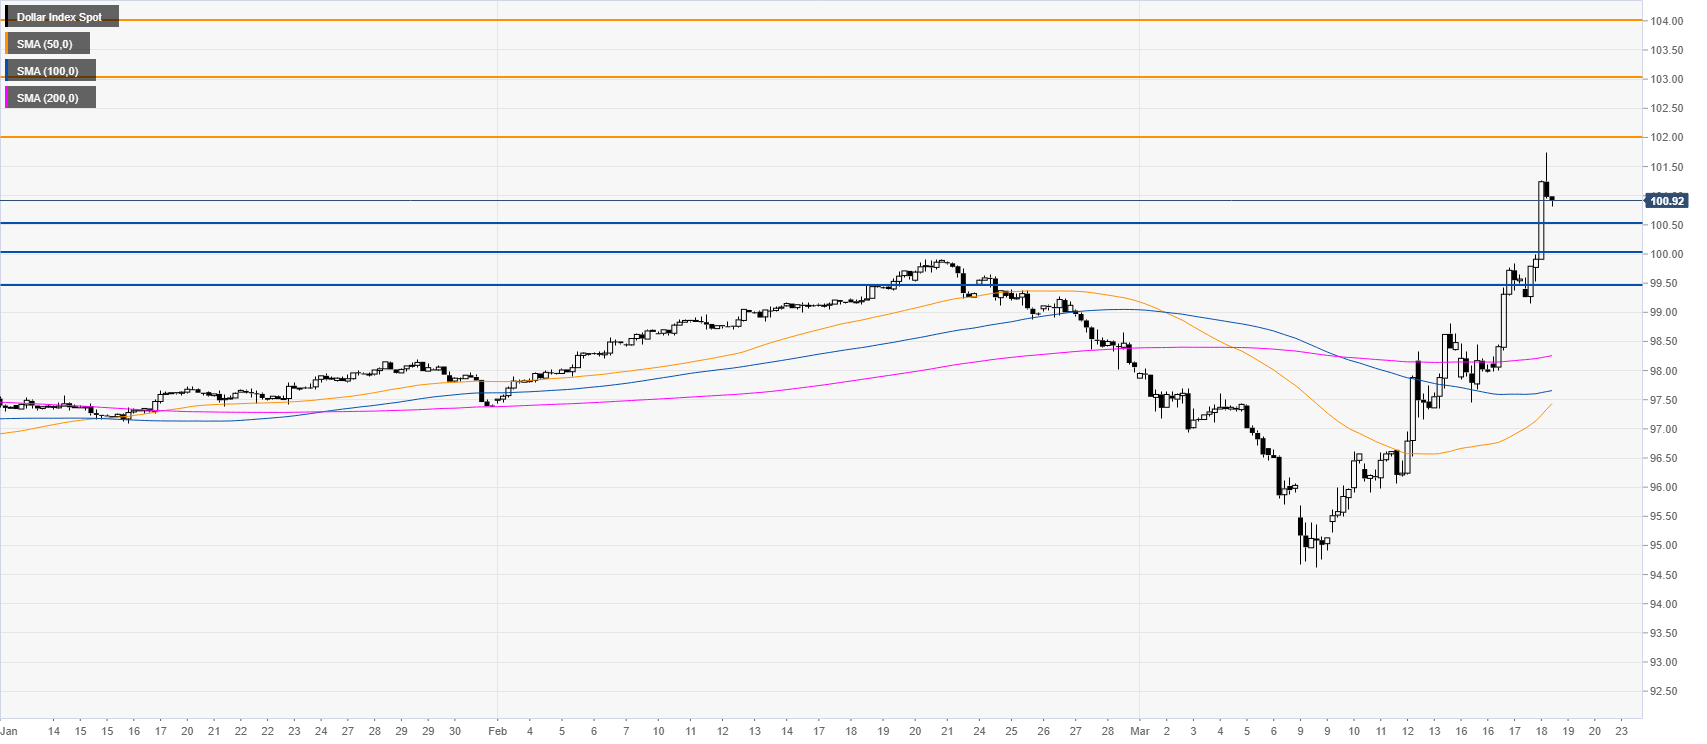
 

DXY four-hour chart

 
The bullish trend remains intact as the market is trading above the main SMAs. Bulls will be looking for a break above the 102.00 figure which could introduce scope to the 103.00 and 104.00 handles over the coming days/weeks. Support can be seen near the 100.50, 100.00 and 99.50 levels on the way down. 
 

Additional key levels

Dollar Index Spot

Overview
Today last price100.92
Today Daily Change1.35
Today Daily Change %1.36
Today daily open99.57
 
Trends
Daily SMA2097.96
Daily SMA5098.01
Daily SMA10097.81
Daily SMA20097.84
 
Levels
Previous Daily High99.84
Previous Daily Low97.98
Previous Weekly High98.81
Previous Weekly Low94.63
Previous Monthly High99.91
Previous Monthly Low97.44
Daily Fibonacci 38.2%99.13
Daily Fibonacci 61.8%98.69
Daily Pivot Point S198.42
Daily Pivot Point S297.27
Daily Pivot Point S396.56
Daily Pivot Point R1100.28
Daily Pivot Point R2100.99
Daily Pivot Point R3102.14

Author

Flavio Tosti

Flavio Tosti

Independent Analyst


More from Flavio Tosti
Share:

Markets move fast. We move first.

Orange Juice Newsletter brings you expert driven insights - not headlines. Every day on your inbox.

By subscribing you agree to our Terms and conditions.

Editor's Picks

EUR/USD holds steady near 1.1750 on first trading day of 2026

EUR/USD stays calm on Friday and trades in a narrow channel at around 1.1750 as trading conditions remain thin following the New Year holiday and ahead of the weekend. The economic calendar will not feature any high-impact data releases.

GBP/USD struggles to gain traction, stabilizes above 1.3450

After testing 1.3400 on the last day of 2025, GBP/USD managed to stage a rebound. Nevertheless, the pair finds it difficult to gather momentum and moves sideways above 1.3450 as market participants remain in holiday mood.

Gold climbs toward $4,400 following deep correction

Gold reverses its direction and advances toward $4,400 after suffering heavy losses amid profit-taking before the New Year holiday. Growing expectations for a dovish Fed policy and persistent geopolitical risks seem to be helping XAU/USD stretch higher.

Cardano gains early New Year momentum, bulls target falling wedge breakout

Cardano kicks off the New Year on a positive note and is extending gains, trading above $0.36 at the time of writing on Friday. Improving on-chain and derivatives data point to growing bullish interest, while the technical outlook keeps an upside breakout in focus.

Economic outlook 2026-2027 in advanced countries: Solidity test

After a year marked by global economic resilience and ending on a note of optimism, 2026 looks promising and could be a year of solid economic performance. In our baseline scenario, we expect most of the supportive factors at work in 2025 to continue to play a role in 2026.

Crypto market outlook for 2026

Year 2025 was volatile, as crypto often is.  Among positive catalysts were favourable regulatory changes in the U.S., rise of Digital Asset Treasuries (DAT), adoption of AI and tokenization of Real-World-Assets (RWA).