US Dollar unable to recover losses with Japan intervening
- The US Dollar retreats firmly after soft CPI release.
- The Fed should no longer be concerned on the disinflationary trajectory.
- The US Dollar index falls further and heads to 104.00.
The US Dollar (USD) is easing firmly on Thursday after the US Consumer Price Index (CPI) for June revealed a substantial decline in inflation. Special remarks for the retail sales which shrank even by 0.1%, meaning that US consumer is no longer willing to pay current prices for goods and is rather awaiting for lower prices before making their purchases. Add in there a softer print for housing and rent, and it looks like the Fed measures put in place are starting to pay off.
On the economic front, most important data for this Thursday is out of the way, and focus will now shift towards Friday on the Producer Price Index (PPI) numbers for June. Meanwhile markets will want to hear from Fed officials that these numbers are what they are looking for, and should trigger a more dovish response from the Fed. With nearly less than two months left, the initial rate cut for the US looks to be locked in for September.
Daily digest market movers: Japan used momentum
- The Japanese Ministry of Trade and Finance refused to give comments, though USD/JPY is down nearly 2%, to 158.50, coming from 161.69 earlier this week. Television network Asahi though confirms that interventions took place just briefly after the US CPI numbers came out.
- Let us walk you through the main numbers that came in this Thursday:
- US CPI for June:
- Monthly headline CPI fell into contraction from +0.1% to -0.1% for June.
- Monthly core CPI declined from 0.2% to 0.1%.
- Annual headline CPI fell from 3.3% to 3.0%.
- Annual core CPI went from 3.4% to 3.3%.
- Weekly Jobless Claims for the week of July 5:
- Initial Claims came in a touch lower, from 239.000 to 222.000.
- Continuing Claims went from 1.856 million to 1.852 million.
- US CPI for June:
- At 15:30 GMT, President of Federal Reserve Bank of Atlanta Raphael Bostic participates in a moderated conversation at the NCUA's Diversity, Equity, and Inclusion Summit in Minneapolis, United States.
- Equity markets are getting dispersed with the Nasdaq dragging the other two major US indices in the red, while European equities get to keep their gains.
- The CME Fedwatch Tool is broadly backing a rate cut in September despite recent comments from Fed officials. The odds now stand at 68.1% for a 25-basis-point cut. A rate pause stands at a 28.6% chance, while a 50-basis-point rate cut has a slim 3.3% possibility.
- The US 10-year benchmark rate trades at 4.17% and prints a fresh low for this week.
US Dollar Index Technical Analysis: Where DXY will close this week will be key
The US Dollar Index (DXY) faces a key pivotal moment with the US Consumer Price Index release for June. This is the make-or-break moment for September rate cut prospects, with any uptick snapping the disinflationary trajectory that would mean that September meeting is off the table. So, expect markets to give a more significant probability of a further easing of the DXY than a stronger US Dollar.
On the upside, the 55-day Simple Moving Average (SMA) at 105.14 remains the first resistance. Should that level be reclaimed again, 105.53 and 105.89 are the following nearby pivotal levels. The red descending trend line in the chart below at around 106.23 and April’s peak at 106.52 could come into play should the Greenback rally substantially.
On the downside, the risk of a nosedive move is increasing, with only the double support at 104.81, which is the confluence of the 100-day SMA and the green ascending trend line from December 2023, still in place. Should that double layer give way, the 200-day SMA at 104.41 is the gatekeeper that should catch the DXY and avoid further declines. Further down, the correction could head to 104.00 as an initial stage.
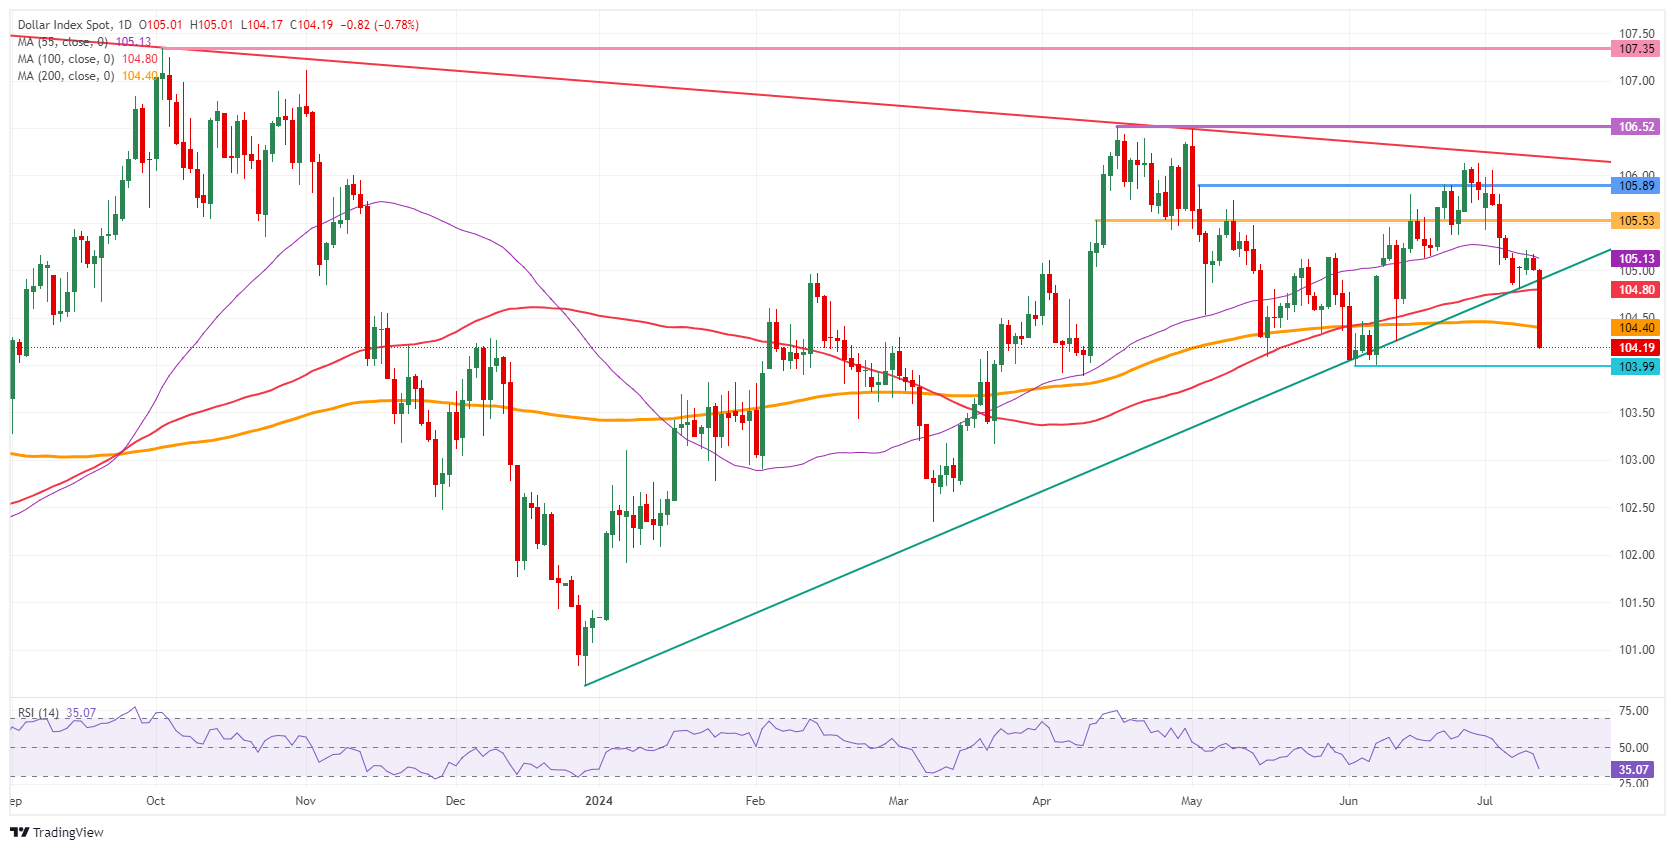
US Dollar Index: Daily Chart
Risk sentiment FAQs
In the world of financial jargon the two widely used terms “risk-on” and “risk off'' refer to the level of risk that investors are willing to stomach during the period referenced. In a “risk-on” market, investors are optimistic about the future and more willing to buy risky assets. In a “risk-off” market investors start to ‘play it safe’ because they are worried about the future, and therefore buy less risky assets that are more certain of bringing a return, even if it is relatively modest.
Typically, during periods of “risk-on”, stock markets will rise, most commodities – except Gold – will also gain in value, since they benefit from a positive growth outlook. The currencies of nations that are heavy commodity exporters strengthen because of increased demand, and Cryptocurrencies rise. In a “risk-off” market, Bonds go up – especially major government Bonds – Gold shines, and safe-haven currencies such as the Japanese Yen, Swiss Franc and US Dollar all benefit.
The Australian Dollar (AUD), the Canadian Dollar (CAD), the New Zealand Dollar (NZD) and minor FX like the Ruble (RUB) and the South African Rand (ZAR), all tend to rise in markets that are “risk-on”. This is because the economies of these currencies are heavily reliant on commodity exports for growth, and commodities tend to rise in price during risk-on periods. This is because investors foresee greater demand for raw materials in the future due to heightened economic activity.
The major currencies that tend to rise during periods of “risk-off” are the US Dollar (USD), the Japanese Yen (JPY) and the Swiss Franc (CHF). The US Dollar, because it is the world’s reserve currency, and because in times of crisis investors buy US government debt, which is seen as safe because the largest economy in the world is unlikely to default. The Yen, from increased demand for Japanese government bonds, because a high proportion are held by domestic investors who are unlikely to dump them – even in a crisis. The Swiss Franc, because strict Swiss banking laws offer investors enhanced capital protection.
Author

Filip Lagaart
FXStreet
Filip Lagaart is a former sales/trader with over 15 years of financial markets expertise under its belt.


