US Dollar trims gains with US yieds retreating ahead of a data-busy week
- US Dollar corrects lower on Monday with the market bracing for a data-packed week in the US.
- Hopes of gradual Fed easing and speculation of a Trump win are keeping USD's downside limited so far.
- The US Dollar is on track to its best monthly performance in the last two years.

The US Dollar (USD), as measured by the US Dollar index DXY, opens the week in a softer tone weighed by lower US Treasury yields as investors brace for an eventful week. The third quarter’s US Gross Domestic Product (GDP), the Personal Consumption Expenditures (PCE) Price Index, and the Nonfarm Payrolls (NFP) report are all out in the coming days.
The broader Dollar trend, however, remains positive as investors dial back hopes of aggressive interest rate cuts by the Federal Reserve (Fed). A raft of strong US economic data and speculation of former US President Donald Trump winning the US presidential election on November 5, with his inflationary policies, are lifting US Treasury yields and dragging the US Dollar higher.
Daily digest market movers: The US Dollar consolidates as investors await growth and labour data
- The Greenback is trading within the previous week’s range, near three-month highs, and on track to a 4% rally in October, on its strongest monthly performance in two years.
- The solid labour figures have consolidated the idea that the US economy is outperforming the rest of the major economies, which will force the Fed to slow down its easing cycle.
- The CME FedWatch tool is pricing a 96% chance of a 25 basis point (bps) cut next week. Two weeks ago, the market was split between a 25 or a 50 bps cut in November.
- The US economy is expected to show a steady 3% yearly growth in the third quarter. In the current global context, these are solid numbers, consistent with a tight labour market and steady inflation.
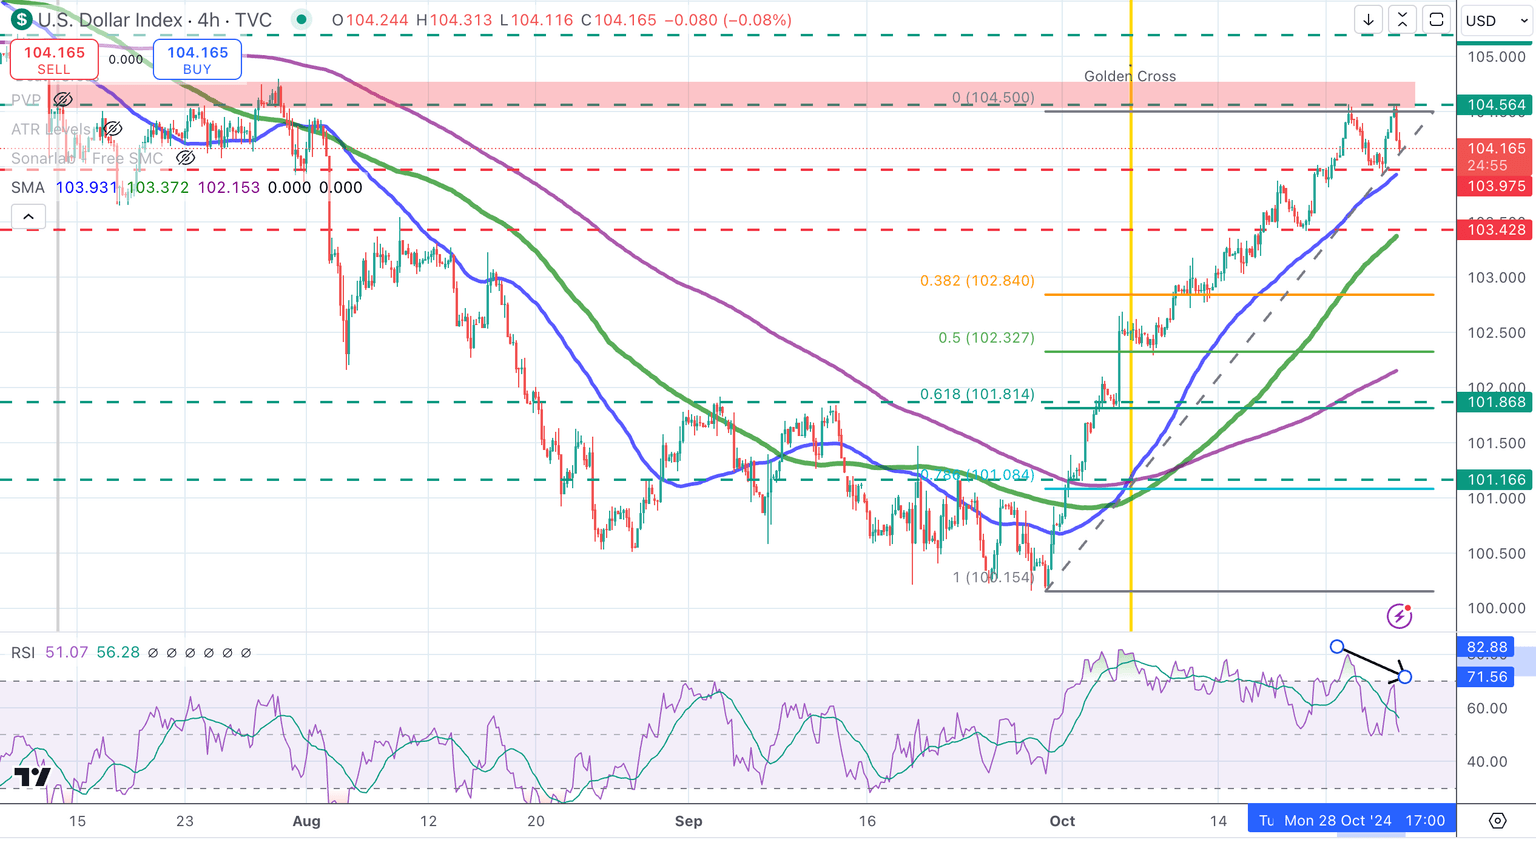
DXY technical outlook: DXY correction approaches a key support area at 103.95
The technical picture shows the DXY index is gathering bearish traction, with price action approaching 104.95, where the 4-hour 50 Simple Moving Average (SMA) meets last Friday's low. The 4-hour Relative Strength Index (RSI) indicator is showing a bearish divergence, and US yields are pulling back, altogether suggesting that a deeper correction might be in progress.
A confirmation below 103.95, would increase pressure towards 103.45 (last week’s low), ahead of the 38.6% Fibonacci retracement, at 102.85 .Resistances are at the 104.55-104.80 range, and above here, at 105.20.
USD Index 4-hour chart

US Dollar FAQs
The US Dollar (USD) is the official currency of the United States of America, and the ‘de facto’ currency of a significant number of other countries where it is found in circulation alongside local notes. It is the most heavily traded currency in the world, accounting for over 88% of all global foreign exchange turnover, or an average of $6.6 trillion in transactions per day, according to data from 2022. Following the second world war, the USD took over from the British Pound as the world’s reserve currency. For most of its history, the US Dollar was backed by Gold, until the Bretton Woods Agreement in 1971 when the Gold Standard went away.
The most important single factor impacting on the value of the US Dollar is monetary policy, which is shaped by the Federal Reserve (Fed). The Fed has two mandates: to achieve price stability (control inflation) and foster full employment. Its primary tool to achieve these two goals is by adjusting interest rates. When prices are rising too quickly and inflation is above the Fed’s 2% target, the Fed will raise rates, which helps the USD value. When inflation falls below 2% or the Unemployment Rate is too high, the Fed may lower interest rates, which weighs on the Greenback.
In extreme situations, the Federal Reserve can also print more Dollars and enact quantitative easing (QE). QE is the process by which the Fed substantially increases the flow of credit in a stuck financial system. It is a non-standard policy measure used when credit has dried up because banks will not lend to each other (out of the fear of counterparty default). It is a last resort when simply lowering interest rates is unlikely to achieve the necessary result. It was the Fed’s weapon of choice to combat the credit crunch that occurred during the Great Financial Crisis in 2008. It involves the Fed printing more Dollars and using them to buy US government bonds predominantly from financial institutions. QE usually leads to a weaker US Dollar.
Quantitative tightening (QT) is the reverse process whereby the Federal Reserve stops buying bonds from financial institutions and does not reinvest the principal from the bonds it holds maturing in new purchases. It is usually positive for the US Dollar.
Author

Guillermo Alcala
FXStreet
Graduated in Communication Sciences at the Universidad del Pais Vasco and Universiteit van Amsterdam, Guillermo has been working as financial news editor and copywriter in diverse Forex-related firms, like FXStreet and Kantox.


