Breaking: US CPI inflation declines to 3.1% in January vs. 2.9% forecast

Inflation in the US, as measured by the change in the Consumer Price Index (CPI), softened to 3.1% on a yearly basis in January from 3.4% in December, the US Bureau of Labor Statistics (BLS) reported on Tuesday. This reading came in above the market expectation of 2.9%. The Core CPI, which excludes volatile food and energy prices, rose 3.9% in the same period, matching the December's increase and surpassing analysts' estimate of 3.7%.
Follow our live coverage of the US inflation report and the market reaction.
On a monthly basis, the CPI and the Core CPI rose 0.3% and 0.4%, respectively.
"The index for shelter continued to rise in January, increasing 0.6% and contributing over two thirds of the monthly all items increase," the BLS said in its press release. "The food index increased 0.4% in January, as the food at home index increased 0.4% and the food away from home index rose 0.5% over the month."
"In contrast, the energy index fell 0.9% over the month due in large part to the decline in the gasoline index," the publication further read.
Market reaction to US CPI data
The US Dollar (USD) gathered strength against its rivals with the immediate reaction. As of writing, the US Dollar Index was up 0.65% on the day at 104.80.
Related content: US stocks on track to open deep in red after US inflation data
US Dollar price today
The table below shows the percentage change of US Dollar (USD) against listed major currencies today. US Dollar was the strongest against the Swiss Franc.
| USD | EUR | GBP | CAD | AUD | JPY | NZD | CHF | |
| USD | 0.58% | 0.26% | 0.43% | 0.89% | 0.69% | 1.07% | 1.11% | |
| EUR | -0.59% | -0.33% | -0.14% | 0.30% | 0.11% | 0.48% | 0.53% | |
| GBP | -0.26% | 0.32% | 0.18% | 0.62% | 0.44% | 0.81% | 0.85% | |
| CAD | -0.44% | 0.14% | -0.19% | 0.47% | 0.28% | 0.65% | 0.70% | |
| AUD | -0.89% | -0.31% | -0.64% | -0.45% | -0.19% | 0.18% | 0.25% | |
| JPY | -0.70% | -0.11% | -0.45% | -0.27% | 0.19% | 0.36% | 0.41% | |
| NZD | -1.08% | -0.45% | -0.82% | -0.64% | -0.19% | -0.38% | 0.04% | |
| CHF | -1.11% | -0.52% | -0.88% | -0.69% | -0.24% | -0.41% | -0.03% |
The heat map shows percentage changes of major currencies against each other. The base currency is picked from the left column, while the quote currency is picked from the top row. For example, if you pick the Euro from the left column and move along the horizontal line to the Japanese Yen, the percentage change displayed in the box will represent EUR (base)/JPY (quote).
This section below was published as a preview of the US Consumer Price Index (CPI) data at 03:00 GMT.
- The US Consumer Price Index is set to rise 2.9% YoY in January, down from December’s 3.4% increase.
- Annual Core CPI inflation is expected to edge lower to 3.7% in January.
- The inflation report could impact the US Dollar by providing clues as to the timing of Fed policy pivot.
The high-impact US Consumer Price Index (CPI) inflation data for January will be published by the Bureau of Labor Statistics (BLS) on Tuesday at 13:30 GMT. Inflation data could alter the market’s pricing of the Federal Reserve (Fed) policy pivot, fuelling extreme volatility around the US Dollar (USD).
What to expect in the next CPI data report?
Inflation in the United States (US) is forecast to rise at an annual pace of 2.9% in January, a tad softer than the 3.4% increase reported in December. The Core CPI inflation rate, which excludes volatile food and energy prices, is forecast to tick down to 3.7% from 3.9% in the same period.
The monthly CPI and the Core CPI are seen increasing 0.2% and 0.3%, respectively.
The BLS announced on Friday that it revised the monthly Consumer Price Index (CPI) increase for December lower to 0.2% from 0.3%. The Core CPI was unrevised at 0.3% for the same period. On the other hand, November's CPI increase was revised higher to 0.2% from 0.1%, while October's 0.1% growth was left unchanged. The BLS noted that CPI revisions reflect the new seasonal adjustment factors.
In January, Oil prices rose more than 6% on growing concerns over a supply shock due to the ongoing crisis in the Red Sea. Meanwhile, Manheim Used Vehicle Index was unchanged in the same period. Previewing the inflation report, “We look for core inflation to stay relatively unchanged at 0.3% m/m in January, with the headline likely slowing a tenth to 0.1%,” said analysts at TD Securities. “Our unrounded core CPI forecast at 0.27% m/m suggests it will be a close call between a 0.2% and a 0.3% gain. The report is likely to show that used vehicle prices were a large drag on inflation, while OER/rents are expected to move sideways.”
How could the US Consumer Price Index report affect EUR/USD?
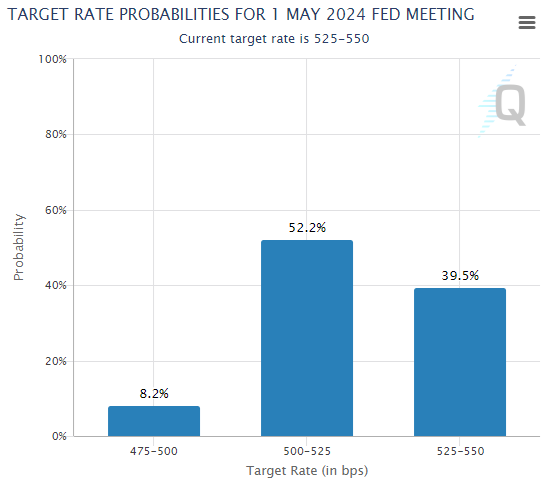
Following the impressive labor market data for January, markets have shifted their view on the timing of the Federal Reserve’s (Fed) policy pivot and refrained from pricing in a rate cut in March. According to the CME FedWatch Tool, the probability of the Fed leaving the policy rate unchanged at the next meeting is stronger than 80%.
At this point, it will take a significant downward surprise, a negative print, in the monthly Core CPI data for markets to reconsider the possibility of a rate reduction in March. In this scenario, US Treasury Bond yields could turn south and weigh on the US Dollar (USD). On the other hand, a stronger-than-forecast increase in this data could have a short-lasting positive impact on the USD’s performance against its rivals.
Markets are still unsure whether the Fed will opt for a rate cut in May. Between now and the policy announcement in May, there will be two more sets of employment and inflation data. Hence, investors might refrain from taking large positions based on January inflation figures and wait to see how the economy evolves in the next couple of months.
Eren Sengezer, European Session Lead Analyst at FXStreet, offers a brief technical outlook for EUR/USD and explains: “EUR/USD holds steady at around 1.0800, where the 100-day Simple Moving Average (SMA) and the Fibonacci 50% retracement of the October-December uptrend align. In case the pair fails to stabilize above that level, 1.0700 (Fibonacci 61.8% retracement) could be seen as next support before 1.0660 (static level) and 1.0600 (psychological level).
“On the upside, the 200-day SMA forms stiff resistance at 1.0840 ahead of 1.0900 (psychological level) and 1.0950 (Fibonacci 23.6% retracement).”
Inflation FAQs
What is inflation?
Inflation measures the rise in the price of a representative basket of goods and services. Headline inflation is usually expressed as a percentage change on a month-on-month (MoM) and year-on-year (YoY) basis. Core inflation excludes more volatile elements such as food and fuel which can fluctuate because of geopolitical and seasonal factors. Core inflation is the figure economists focus on and is the level targeted by central banks, which are mandated to keep inflation at a manageable level, usually around 2%.
What is the Consumer Price Index (CPI)?
The Consumer Price Index (CPI) measures the change in prices of a basket of goods and services over a period of time. It is usually expressed as a percentage change on a month-on-month (MoM) and year-on-year (YoY) basis. Core CPI is the figure targeted by central banks as it excludes volatile food and fuel inputs. When Core CPI rises above 2% it usually results in higher interest rates and vice versa when it falls below 2%. Since higher interest rates are positive for a currency, higher inflation usually results in a stronger currency. The opposite is true when inflation falls.
What is the impact of inflation on foreign exchange?
Although it may seem counter-intuitive, high inflation in a country pushes up the value of its currency and vice versa for lower inflation. This is because the central bank will normally raise interest rates to combat the higher inflation, which attract more global capital inflows from investors looking for a lucrative place to park their money.
How does inflation influence the price of Gold?
Formerly, Gold was the asset investors turned to in times of high inflation because it preserved its value, and whilst investors will often still buy Gold for its safe-haven properties in times of extreme market turmoil, this is not the case most of the time. This is because when inflation is high, central banks will put up interest rates to combat it.
Higher interest rates are negative for Gold because they increase the opportunity-cost of holding Gold vis-a-vis an interest-bearing asset or placing the money in a cash deposit account. On the flipside, lower inflation tends to be positive for Gold as it brings interest rates down, making the bright metal a more viable investment alternative.
Author

FXStreet Team
FXStreet


