US 100 index: Bullish outlook at risk after poor Q1
-
US 100 loses 5.2% YTD.
-
Fed policy and tariffs are the main drags on US indices.
-
Technically, prices are attempting to recover.

The US 100 index has had a negative performance in Q1 2025 with a -5.2% year-to-date performance. Corporate profits grew in 2024, and analysts expect continued growth in 2025 but at a slower pace. Consumer spending was positive, supported by a healthy job market, though this may not be sustainable for much longer. The Fed cut interest rates in the last few months of 2024 to support growth but has been on hold since the start of the year and will only unpause if inflation declines in the coming months.
The US economy expanded by an annualized 2.3% in Q4 2024, the slowest in three quarters. Personal consumption increased by 4.2%, the most since Q1 2023. However, consumer sentiment fell to 57.9 in March 2025 according to the University of Michigan survey, the lowest since November 2022, due to uncertainty around tariff policy and economic worries.
The US administration's aggressive trade policies, including increased tariffs on Chinese imports and sweeping tariffs on Canada and Mexico, led to significant market volatility. These unpredictable moves resulted in a sharp sell-off in US equities.
Technical view
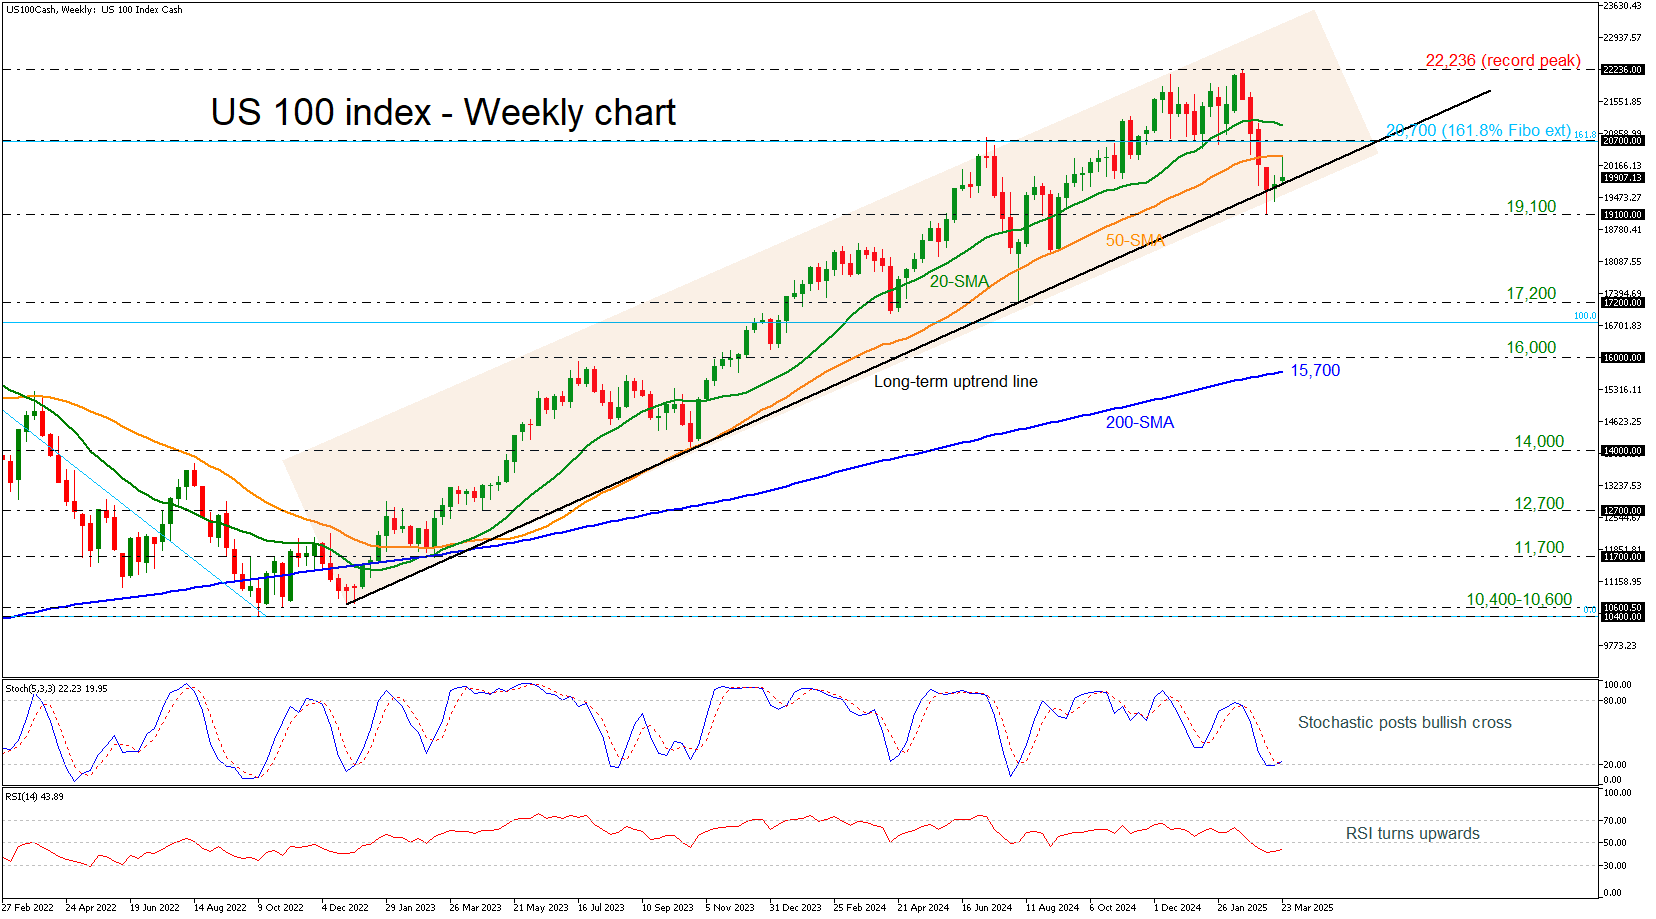
In the weekly timeframe, the US 100 cash index found a strong support level near the 19,100 barrier and the long-term ascending trend line, after four consecutive red weeks. The index lost more than 14% from the record peak at 22,236, but it is still holding within the upward sloping channel, which has been drawn since the end of December 2022.
From a technical standpoint, the stochastic oscillator posted a bullish crossover between its %K and %D lines in the oversold territory, while the RSI is trying to gain some ground below the neutral threshold of 50.
In case of an upside recovery, immediate resistance is coming from the 50-week simple moving average (SMA) at 20,400 ahead of the 161.8% Fibonacci extension level of the down leg from 16,700 to 10,400 at 20,700. More increases could lead the bulls toward the all-time high of 22,236 and the 261.8% Fibonacci at 27,000.
Alternatively, a penetration of the long-term ascending trend line and the 19,100 barricade could open the way for steeper decreases until the 17,200 support and the 16,000 handle. More importantly, the 200-week SMA at 15,700 may prove to be the turning point in the market, acting as a significant support line.
To sum up, the overall outlook for US 100 is positive in the long-term picture and only a plunge below the 200-week SMA may change this view.
Author

Melina joined XM in December 2017 as an Investment Analyst in the Research department. She can clearly communicate market action, particularly technical and chart pattern setups.


