|premium|

Uranium Miners ETF ($URA) Has Started Next Bullish Cycle

The Global X Uranium ETF ($URA) is an exchange-traded fund (ETF) that seeks to provide investment results that correspond generally to the price and yield performance of the Solactive Global Uranium & Nuclear Components Total Return Index. In this article, we will look at the long term technical outlook using Elliott Wave method.

$URA Elliott Wave Chart Monthly Chart

Uranium ETF (URA) Monthly Chart above held up the horizontal support/resistance at $19. The ETF has started to turn higher and should start the next bullish cycle higher. Wave ((II)) ended on March 1, 2020 low at 6.95. Up from there, wave I ended at 31.6 and pullback in wave II ended at 17.65. While pullback stays above 17.65, expect the ETF to continue higher in months and years to come.

$URA Daily Elliott Wave Chart

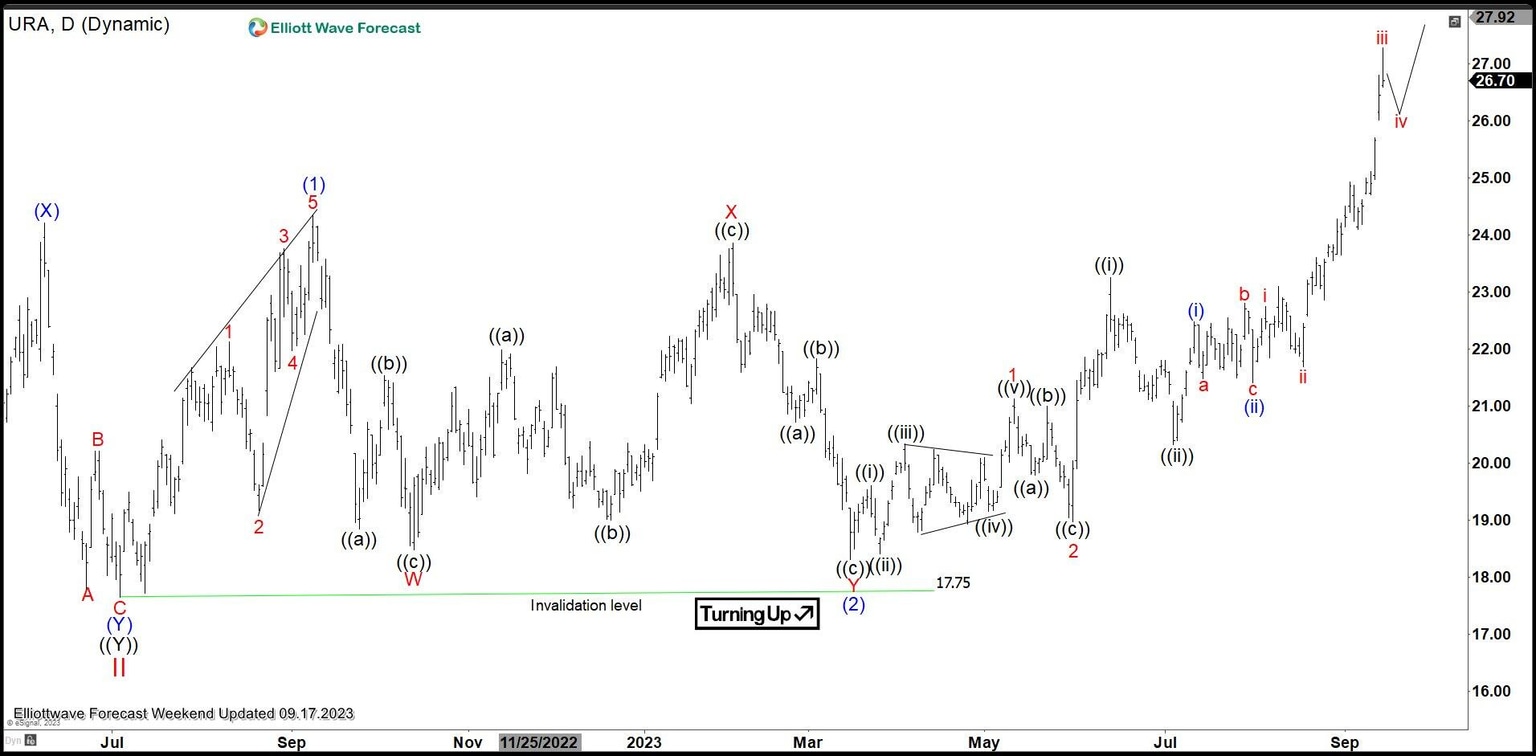
After forming major low at 6.95 on March 2020, ETF (URA) rallied in wave (1) towards 24.34.

Dips in wave (2) ended at 18.31 as a double three. Down from wave (I), wave W ended at 18.47 and rally in wave X ended at 23.86. The ETF then extended lower in wave Y towards 18.31 which completed wave (2). It has resumed higher in wave (3) with internal subdivision as a 5 waves. Up from wave (2), wave 1 ended at 21.12 and dips in wave 2 ended at 18.97. Expect the ETF to continue to extend higher within wave 3.

Premium

You have reached your limit of 3 free articles for this month.

Start your subscription and get access to all our original articles.

Subscribe to PremiumSign In

Author

Elliott Wave Forecast Team

Elliott Wave Forecast Team

ElliottWave-Forecast.com

More from Elliott Wave Forecast Team
Share:

Editor's Picks

EUR/USD flirts with daily highs, retargets 1.1900

EUR/USD regains upside traction, returning to the 1.1880 zone and refocusing its attention to the key 1.1900 barrier. The pair’s slight gains comes against the backdrop of a humble decline in the US Dollar as investors continue to assess the latest US CPI readings and the potential Fed’s rate path.

GBP/USD remains well bid around 1.3650

GBP/USD maintains its upside momentum in place, hovering around daily highs near 1.3650 and setting aside part of the recent three-day drop. Cable’s improved sentiment comes on the back of the Greenback’s  irresolute price action, while recent hawkish comments from the BoE’s Pill also collaborate with the uptick.

Gold clings to gains just above $5,000/oz

Gold is reclaiming part of the ground lost on Wednesday’s marked decline, as bargain-hunters keep piling up and lifting prices past the key $5,000 per troy ounce. The precious metal’s move higher is also underpinned by the slight pullback in the US Dollar and declining US Treasury yields across the curve.

Crypto Today: Bitcoin, Ethereum, XRP in choppy price action, weighed down by falling institutional interest 

Bitcoin's upside remains largely constrained amid weak technicals and declining institutional interest. Ethereum trades sideways above $1,900 support with the upside capped below $2,000 amid ETF outflows.

Week ahead – Data blitz, Fed Minutes and RBNZ decision in the spotlight

US GDP and PCE inflation are main highlights, plus the Fed minutes. UK and Japan have busy calendars too with focus on CPI. Flash PMIs for February will also be doing the rounds. RBNZ meets, is unlikely to follow RBA’s hawkish path.

Ripple Price Forecast: XRP potential bottom could be in sight

Ripple edges up above the intraday low of $1.35 at the time of writing on Friday amid mixed price actions across the crypto market. The remittance token failed to hold support at $1.40 the previous day, reflecting risk-off sentiment amid a decline in retail and institutional sentiment.