|

Uranium Miners ETF ($URA): Correction likely over, now rising

The Global X Uranium ETF (URA) tracks a market-cap-weighted index of companies in the uranium mining and nuclear components sector. The ETF, featuring key holdings like Cameco Corp, has a market cap of approximately $3.9 billion and a dividend yield of about 6.07%. Elliott Wave Technical Analysis point to continued growth potential.

$URA Elliott Wave chart monthly chart

Chart

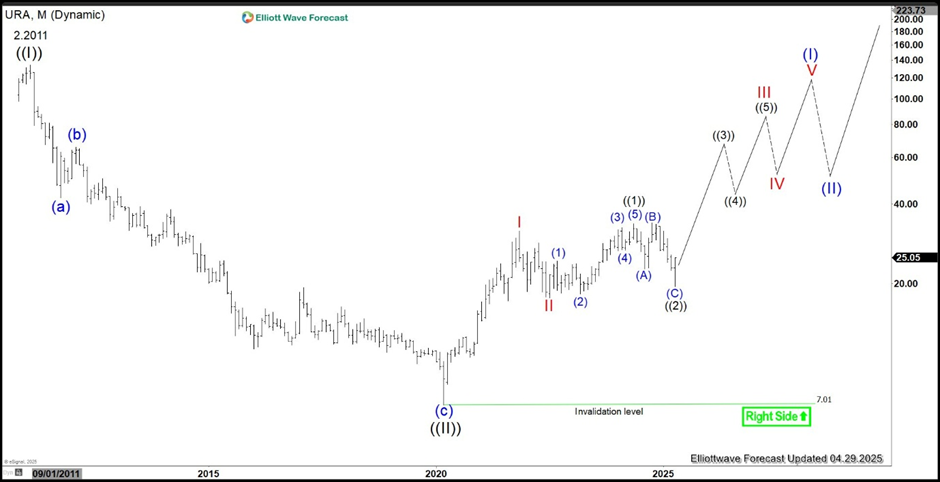
The monthly chart of $URA indicates that the ETF completed wave ((II)) of the Grand Super Cycle at 7.01. Since then, it has been advancing in an impulsive structure. From the March 18, 2020 low, wave I peaked at 31.60, followed by a wave II pullback that concluded at 17.65. The ETF then progressed in wave III, which unfolds in five sub-waves. From the wave II low, wave ((1)) reached 33.66, and the wave ((2)) pullback ended at 19.50. As long as the 7.01 pivot remains intact, the ETF is expected to continue its upward trajectory.

$URA daily Elliott Wave chart

Chart

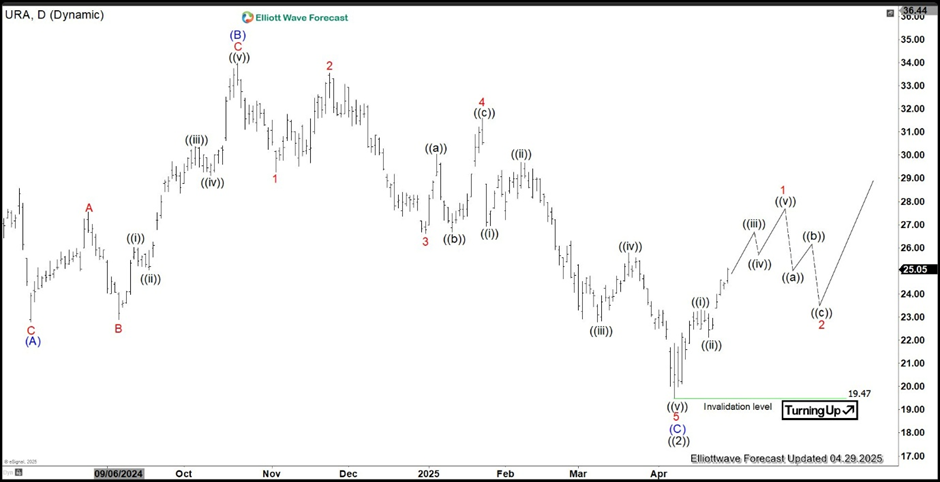
The daily chart of $URA indicates that wave ((2)) concluded at 19.47, unfolding as an expanded flat. Within this structure, wave (A) bottomed at 22.79, wave (B) rallied to 33.99, and wave (C) declined to 19.47, completing wave ((2)). The ETF has since turned higher, and as long as the 19.47 pivot holds, any pullbacks are expected to find support in a 3, 7, or 11-swing structure, setting the stage for further upside.

Author

Elliott Wave Forecast Team

Elliott Wave Forecast Team

ElliottWave-Forecast.com

More from Elliott Wave Forecast Team
Share:

Editor's Picks

EUR/USD accelerates losses, focus is on 1.1800

EUR/USD’s selling pressure is gathering pace now, opening the door to a potential test of the key 1.1800 region sooner rather than later. The pair’s pullback comes on the back of marked gains in the US Dollar following US data releases and the publication of the FOMC Minutes later in the day.

GBP/USD turns negative near 1.3540

GBP/USD reverses its initial upside momentum and is now adding to previous declines, revisiting at the same time the 1.3540 region on Wednesday. Cable’s downtick comes on the back of decent gains in the Greenback and easing UK inflation figures, which seem to have reinforced the case for a BoE rate cut in March.

Gold battle to regain $5,000 continues

Gold is back on the front foot on Wednesday, shaking off part of the early week softness and challenging two-day highs just above the key $5,000 mark per troy ounce. The move comes ahead of the FOMC Minutes and is unfolding despite an intense rebound in the US Dollar.

Fed Minutes to shed light on January hold decision amid hawkish rate outlook

The Minutes of the Fed’s January 27-28 monetary policy meeting will be published today. Details of discussions on the decision to leave the policy rate unchanged will be scrutinized by investors.

Mixed UK inflation data no gamechanger for the Bank of England

Food inflation plunged in January, but service sector price pressure is proving stickier. We continue to expect Bank of England rate cuts in March and June. The latest UK inflation read is a mixed bag for the Bank of England, but we doubt it drastically changes the odds of a March rate cut.

Sui extends sideways action ahead of Grayscale’s GSUI ETF launch

Sui is extending its downtrend for the second consecutive day, trading at 0.95 at the time of writing on Wednesday. The Layer-1 token is down over 16% in February and approximately 34% from the start of the year, aligning with the overall bearish sentiment across the crypto market.