|

Uranium ETF (URA) still has not confirmed bottom

The long term fundamental background in the next few years for Uranium remains very good. With the world in energy crisis and in need of a green energy, Uranium offers an alternative source. One way to capitalize on this opportunity is with the Uranium Miners ETF (URA). The ETF invests on the Uranium itself as well as several mining companies in this sector.

$URA Elliott Wave chart monthly chart

URA

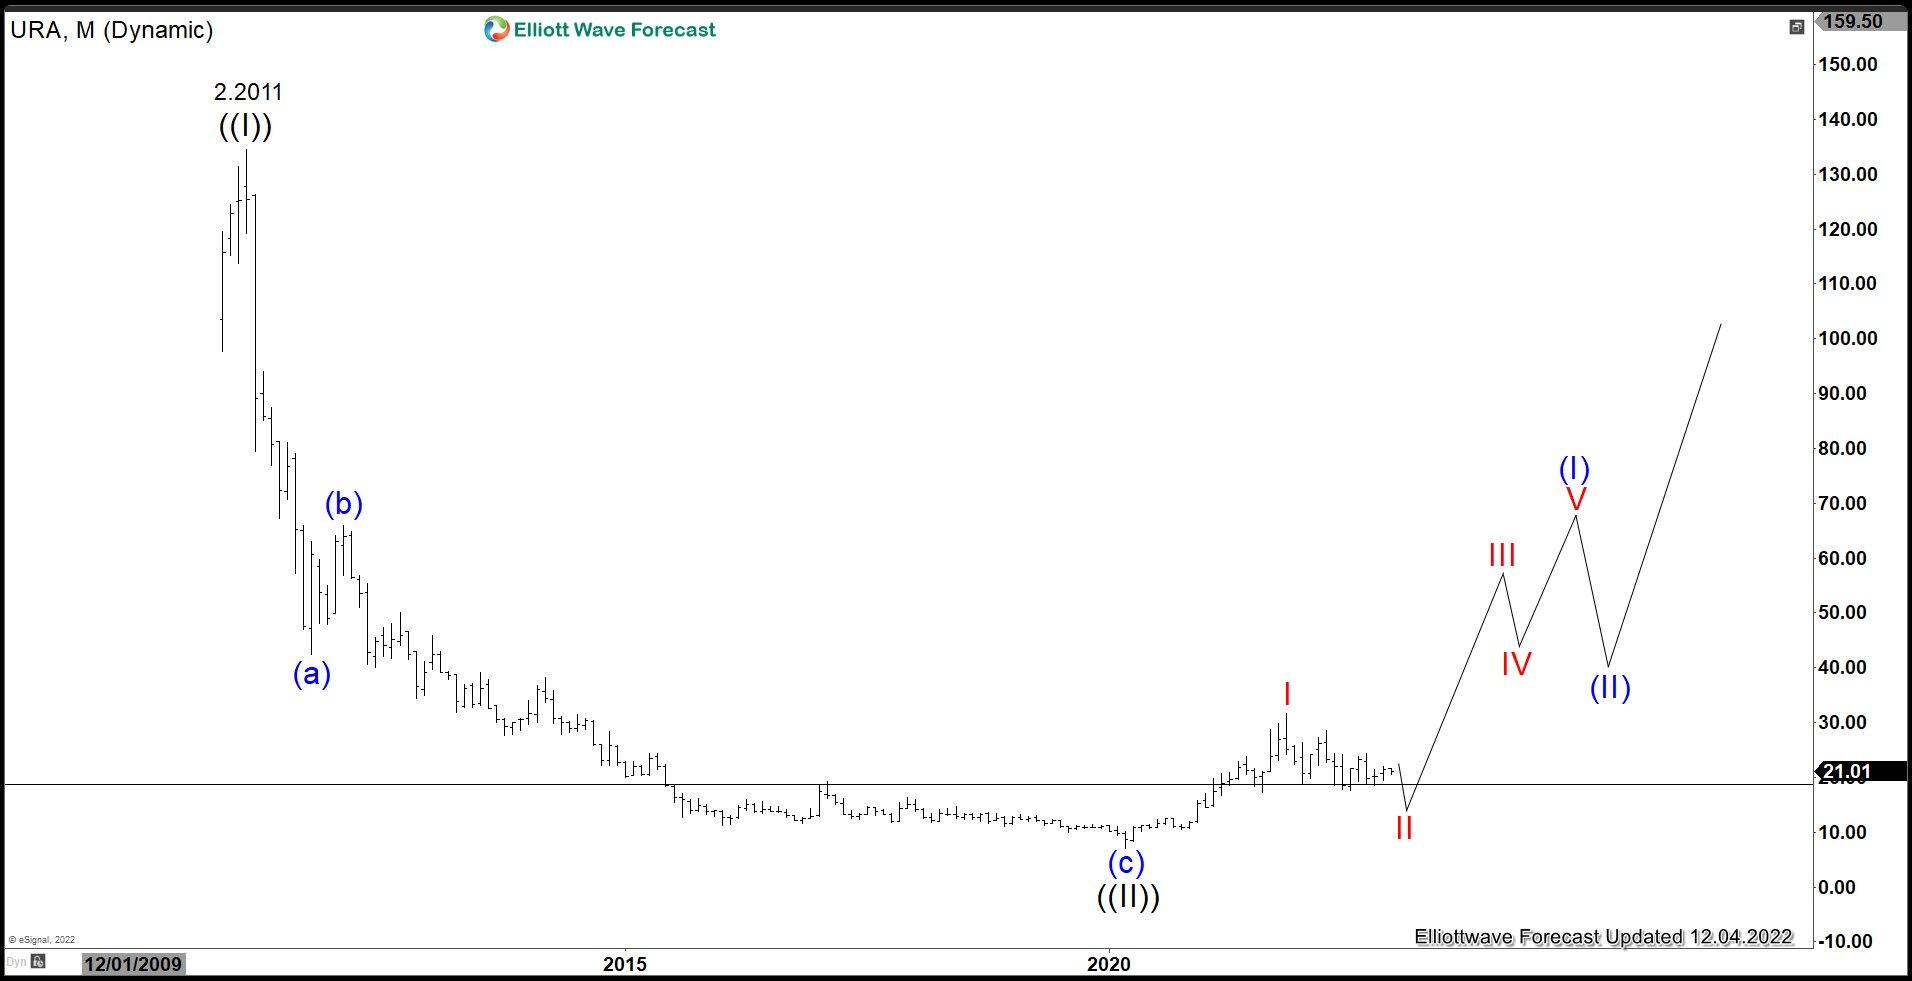
Uranium ETF (URA) Monthly Chart above shows that the instrument is correcting cycle from March 2020 low within wave II. Pullback so far still has not shown any sign of bottoming. Structure of the instrument still hasn’t reached the ideal extension to end wave II. The weekly and monthly outlook however is bullish even though further downside still can’t be completely ruled out at this stage. Daily time frame below shows the ideal extension to end wave II.

$URA daily Elliott Wave chart

URA

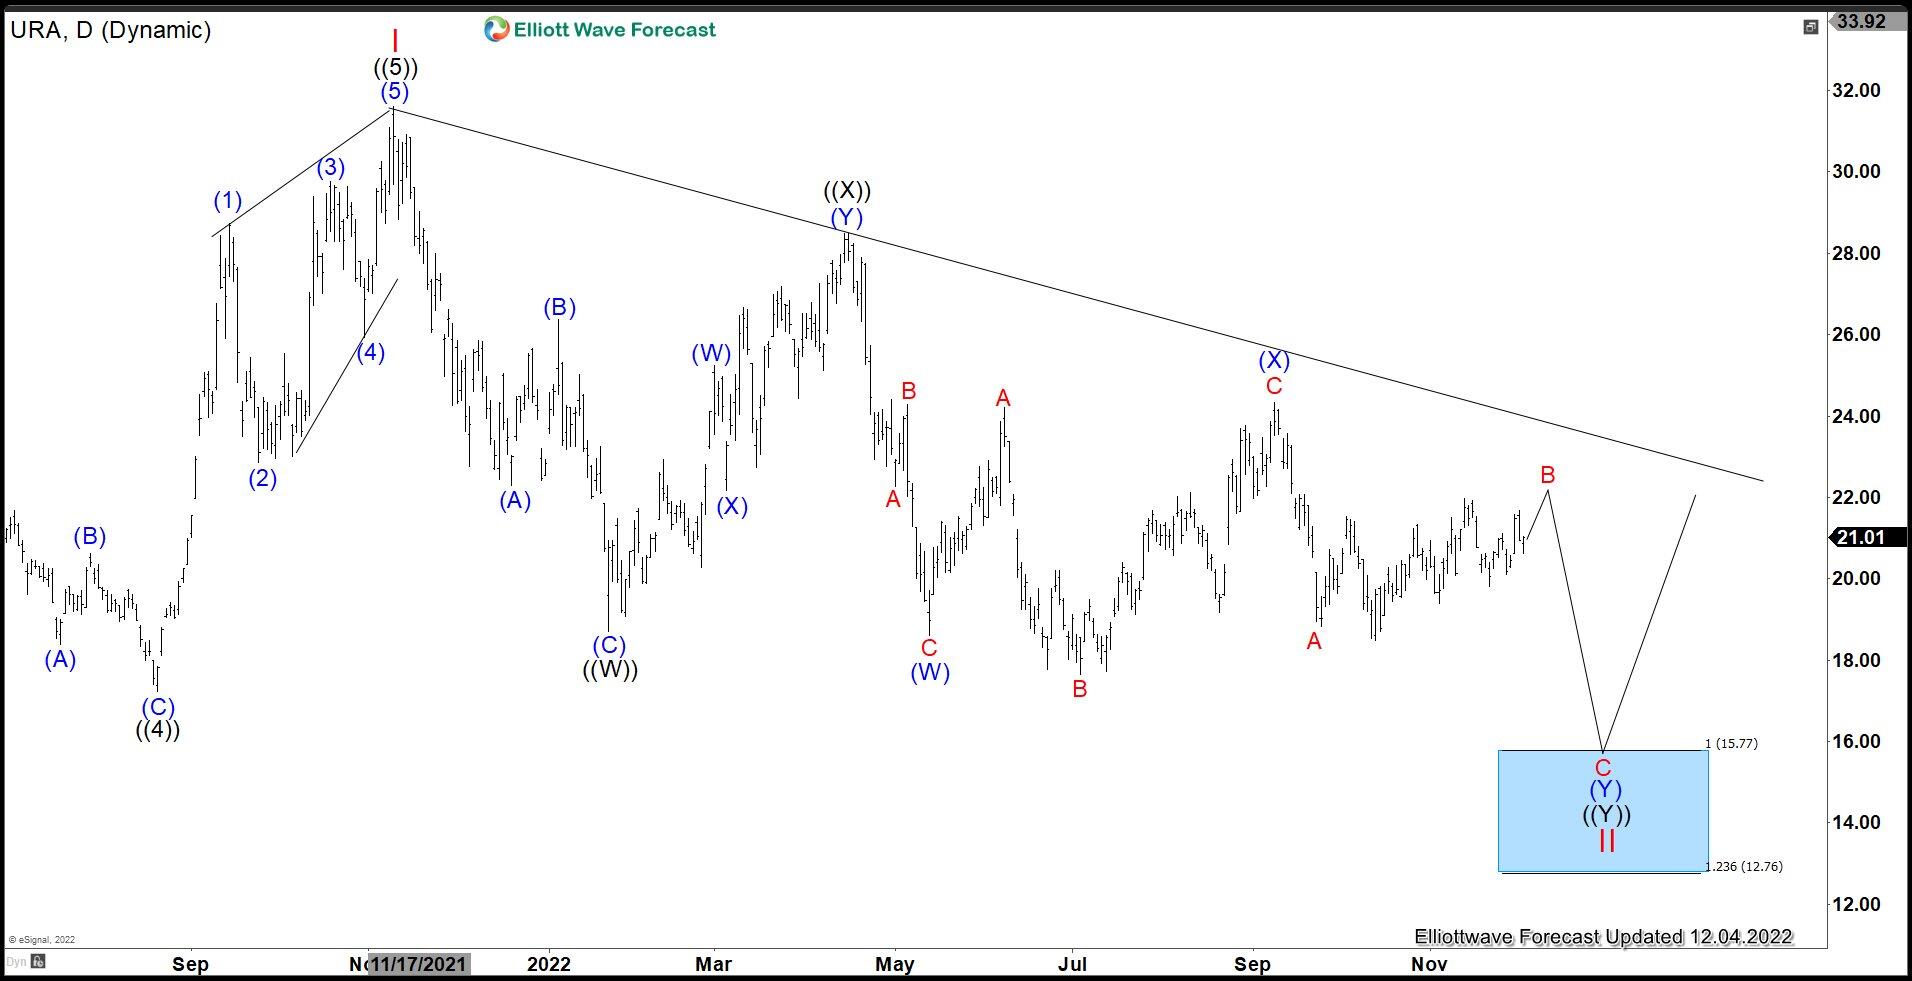
Daily Elliott Wave Chart of Uranium ETF (URA) above shows that wave II is in progress to correct cycle from 3.18.2020 low and the ideal target is a 100% extension from 11.9.2021 high which comes at 12.76 – 15.77. So far the instrument has not shown any sign of bottoming yet as it still continues to stay below the descending trend line. Near term, while below wave (X) at $24.34, it still has scope to extend lower towards $12.76 – $15.77 where strong buyers should appear. Break and close above the trend line however may suggest truncation and wave II to finish without reaching the full 100%.

Author

Elliott Wave Forecast Team

Elliott Wave Forecast Team

ElliottWave-Forecast.com

More from Elliott Wave Forecast Team
Share:

Editor's Picks

EUR/USD weakens as US jobs data trims Fed rate cut bets

The EUR/USD pair trades in negative territory for the third consecutive day near 1.1860 during the early European session on Thursday. Traders will keep an eye on the US weekly Initial Jobless Claims data. On Friday, the attention will shift to the US Consumer Price Index inflation report. 

GBP/USD bullish outlook prevails above 1.3600, UK GDP data looms

The GBP/USD pair gains ground near 1.3635, snapping the two-day losing streak during the early European session on Thursday. The preliminary reading of UK Gross Domestic Product for the fourth quarter will be closely watched later on Thursday. The UK economy is estimated to grow 0.2% QoQ in Q4, versus 0.1% in Q1. 

Gold remains on the defensive below two-week top; lacks bearish conviction amid mixed cues

Gold sticks to modest intraday losses through the Asian session on Thursday, though it lacks follow-through selling and remains close to a nearly two-week high, touched the previous day. The commodity currently trades above the $5,070 level, down just over 0.20% for the day, amid mixed cues.

UK GDP set to post weak growth as markets rise bets on March rate cut

Markets will be watching closely on Thursday, when the United Kingdom’s Office for National Statistics will release the advance estimate of Q4 Gross Domestic Product. If the data land in line with consensus, the UK economy would have continued to grow at an annualised pace of 1.2%, compared with 1.3% recorded the previous year. 

The market trades the path not the past

The payroll number did not just beat. It reset the tone. 130,000 vs. 65,000 expected, with a 35,000 whisper. 79 of 80 economists leaning the wrong way. Unemployment and underemployment are edging lower. For all the statistical fog around birth-death adjustments and seasonal quirks, the core message was unmistakable. The labour market is not cracking.

Sonic Labs’ vertical integration fuels recovery in S token

Sonic, previously Fantom (FTM), is extending its recovery trade at $0.048 at the time of writing, after rebounding by over 12% the previous day. The recovery thesis’ strengths lie in the optimism surrounding Sonic Labs’ Wednesday announcement to shift to a vertically integrated model, aimed at boosting S token utility.