|

Uranium ETF (URA) pullback in progress

In our previous article, we mentioned that Uranium ETF (ticker URA) has ended correction to the cycle from 2020 low and ready to resume higher. In this article, we will update the outlook for the ETF. We see the commodity complex forming a high on early February 2023 and pulling back. We see further pullback in $URA in near term before it is ready to resume higher again.

$URA Elliott Wave chart monthly chart

URA

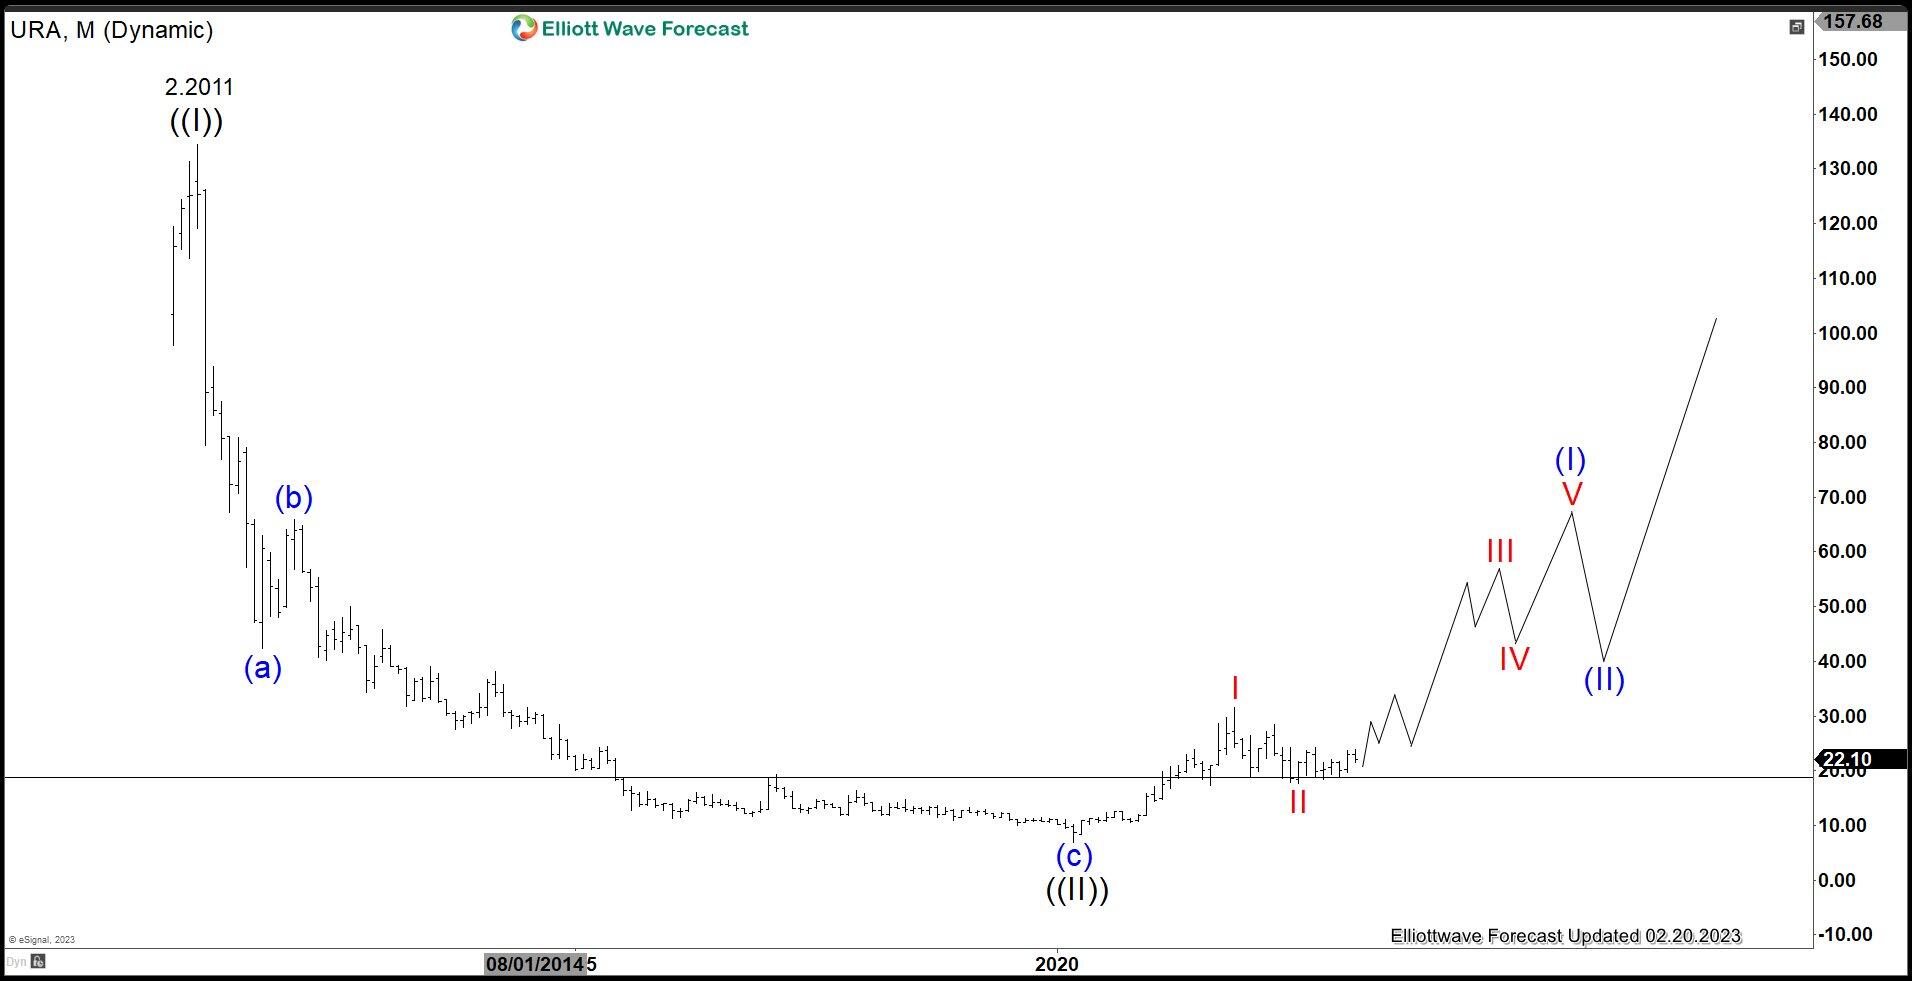
Uranium ETF (URA) Monthly Chart above shows a horizontal support/resistance at $19. The ETF so far continues to hold above that level, which is a good sign. Since it bottomed on March 1, 2020 low along with other World Indices, it has started to rally in what we call as a 5 waves. We label the bottom on March 1, 2020 low as wave ((II)) at 6.95. Up from there, the ETF starts a new bullish leg with wave I ended at 31.6 and pullback in wave II ended at 17.65. While it stays above 17.65, expect the ETF to continue higher in months to come.

$URA daily Elliott Wave chart

Chart

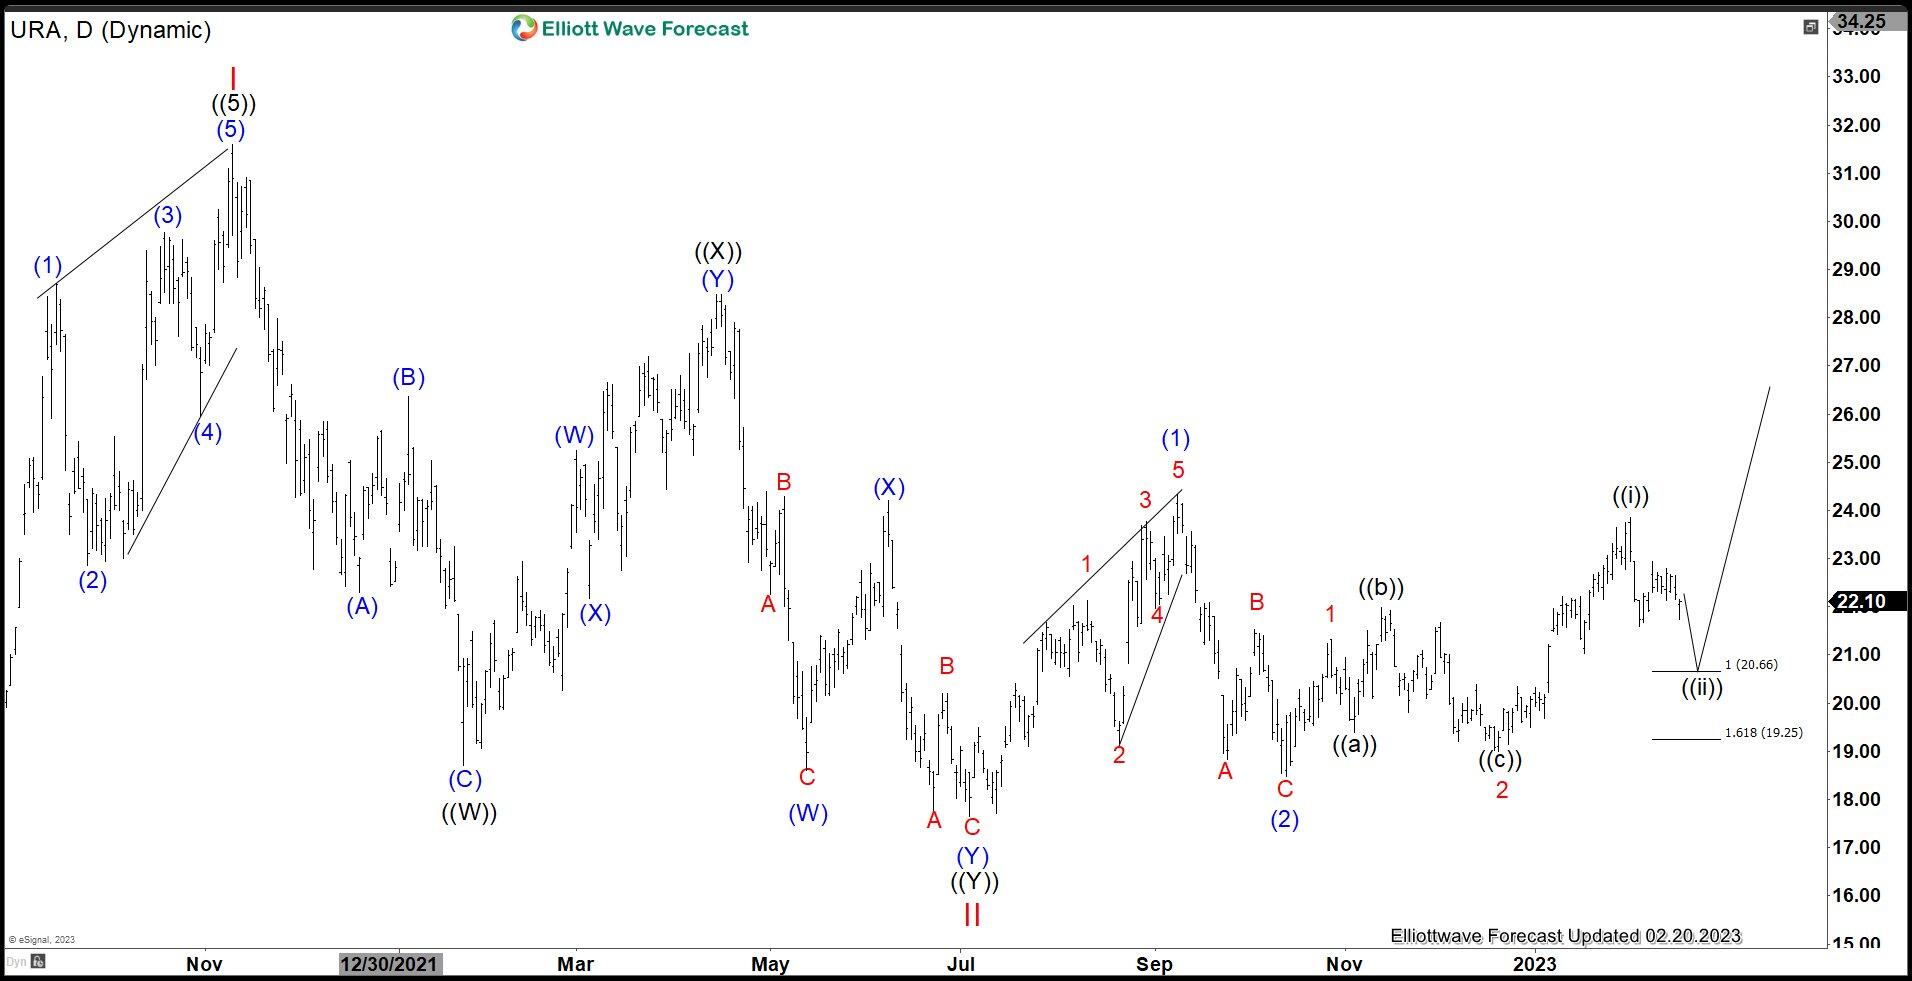
While the major low in ETF came at 6.95 on March 2020, daily Elliott Wave Chart of Uranium ETF (URA) above shows that the ETF possibly has formed a secondary low at 17.65. We label this secondary low as wave II. From there, it has rallied higher in a series of nest. Up from wave II, wave (1) ended at 24.34 and pullback in wave (2) ended at 18.47. The ETF extends higher again in wave 1 at 21.33 and wave 2 ended at 19. The last high on February 2 was a wave ((i)) at 23.86. Expect a pullback in wave ((ii)) to continue to reach the extreme area of 19.25 – 20.66 before the ETF extends higher again. As far as wave 2 low at 19 holds, dips should find support in 3, 7, or 11 swing for further upside.

Author

Elliott Wave Forecast Team

Elliott Wave Forecast Team

ElliottWave-Forecast.com

More from Elliott Wave Forecast Team
Share:

Editor's Picks

EUR/USD hits two-day highs near 1.1820

EUR/USD picks up pace and reaches two-day tops around 1.1820 at the end of the week. The pair’s move higher comes on the back of renewed weakness in the US Dollar amid growing talk that the Fed could deliver an interest rate cut as early as March. On the docket, the flash US Consumer Sentiment improves to 57.3 in February.

GBP/USD reclaims 1.3600 and above

GBP/USD reverses two straight days of losses, surpassing the key 1.3600 yardstick on Friday. Cable’s rebound comes as the Greenback slips away from two-week highs in response to some profit-taking mood and speculation of Fed rate cuts. In addition, hawkish comments from the BoE’s Pill are also collaborating with the quid’s improvement.

Gold climbs further, focus is back to 45,000

Gold regains upside traction and surpasses the $4,900 mark per troy ounce at the end of the week, shifting its attention to the critical $5,000 region. The move reflects a shift in risk sentiment, driving flows back towards traditional safe haven assets and supporting the yellow metal.

Crypto Today: Bitcoin, Ethereum, XRP rebound amid risk-off, $2.6 billion liquidation wave

Bitcoin edges up above $65,000 at the time of writing on Friday, as dust from the recent macro-triggered sell-off settles. The leading altcoin, Ethereum, hovers above $1,900, but resistance at $2,000 caps the upside. Meanwhile, Ripple has recorded the largest intraday jump among the three assets, up over 10% to $1.35.

Three scenarios for Japanese Yen ahead of snap election

The latest polls point to a dominant win for the ruling bloc at the upcoming Japanese snap election. The larger Sanae Takaichi’s mandate, the more investors fear faster implementation of tax cuts and spending plans. 

XRP rally extends as modest ETF inflows support recovery

Ripple is accelerating its recovery, trading above $1.36 at the time of writing on Friday, as investors adjust their positions following a turbulent week in the broader crypto market. The remittance token is up over 21% from its intraday low of $1.12.