Unveiling the hidden message in the S&P 500’s price and volume trend [Video]
![Unveiling the hidden message in the S&P 500’s price and volume trend [Video]](https://editorial.fxstreet.com/images/Markets/Equities/SP500/wall_street_nyse3-637299021683820849_XtraLarge.jpg)
The subtle price and volume pattern shown up last week could suggest more testing and consolidation in S&P 500. Scenarios analysis with the key levels in S&P 500 were discussed regarding the reaction from the CPI economic data.
Watch the video below to find out how to use the Wyckoff method with volume spread analysis to interpret the hidden message from the price and volume analysis.
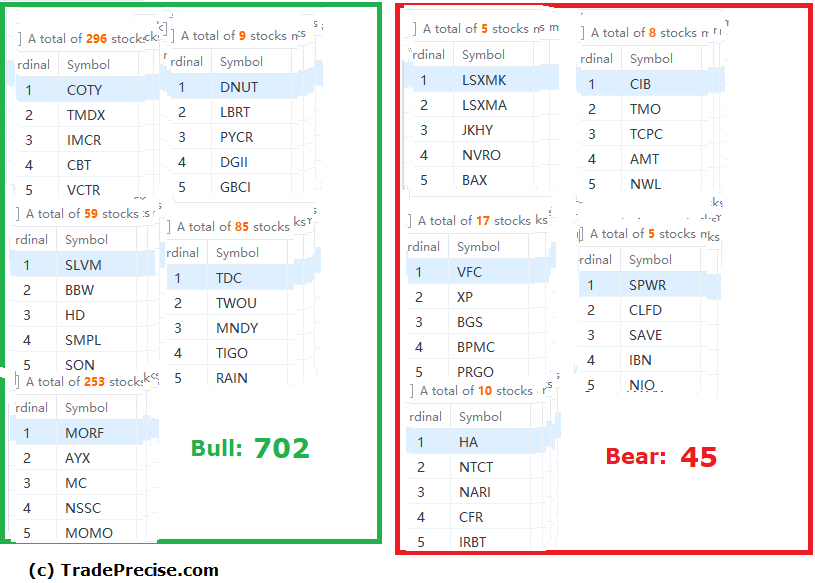
The bullish setup vs. the bearish setup is 702 to 45 from the screenshot of my stock screener below suggested a positive market environment.
Pay attention to the key levels as discussed in the video as a violation of them could suggest more weakness ahead.
Although the market environment is positive as reflected in the stock screener above, the volatility is still high as reflected in the breakout failure in some of the outperforming stocks. So, now is still not the time to be aggressive in trading or investing. The video above is part of the latest Weekly Live Group Coaching Session (1.5 hours).
Author

Ming Jong Tey
Independent Analyst
Ming Jong Tey has been trading since 2008. He started his learning journey from technical analysis (indicators, Fibonacci, etc...) to value investing. Throughout his journey, he develops an interest in price action with chart pattern trading.


