- Tesla (TSLA) stock craters nearly 12% on Tuesday.
- Tesla shares then bounce 4% on Wednesday.
- On Thursday, TSLA bounced again in Frankfurt by 4%.
Tesla (TSLA) shares are nothing if not volatile, and we know well by now how high beta these shares are. Refinitiv data puts the beta at just over 2, which is significant for such a mega-cap name. For those not in the know, beta is just a fancy term to make us sound intelligent when talking about how much a stock moves versus the main index. So in this case, if the S&P 500 moves 1%, Tesla on average will move 2%, be that up or down. Volatility, in other words, is high for this one. Tesla is once again proving its point with some huge swings. Down 11%, up 4%, and now looking at more gains in the region of 2 to 4% on Thursday. Hard to keep up with this one, and Elon Musk keeps it interesting if nothing else.
Tesla graph, 15-minute
Tesla (TSLA) stock news
Elon Musk took to Twitter over the weekend to propose selling 10% of his holding in Tesla. About 3.5 million votes were cast with the majority in favour of him selling. Elon Musk said he would abide by the results of that poll, and it appears he stuck to his word. News out this morning shows him selling a decent chunk of change worth of Tesla.
Filings show Elon Musk sold approximately $5 billion worth of shares. This was his first sale of stock since 2016. Usually, a CEO offloading such a large stock would be taken negatively by market participants since insider filings are closely watched by investors. But the way Elon Musk structured his reasoning may make investors overlook this one for now. Elon Musk looks to have sold about 3% of his holding.
Tesla (TSLA) stock forecast
The TSLA quote is currently at $1,105 in Thursday's premarket, up about 3.5%. That brings the stock neatly up to the 9-day moving average and close to our $1,120 level of resistance identified in the chart below. This is the short-term pivot, and we expect failure. We may be wrong, so use stops accordingly. A break of $1,120 means short-term momentum is back in a big way, and record highs would then be targeted. $1,000 remains strong support and the first target. This is the medium term pivot.
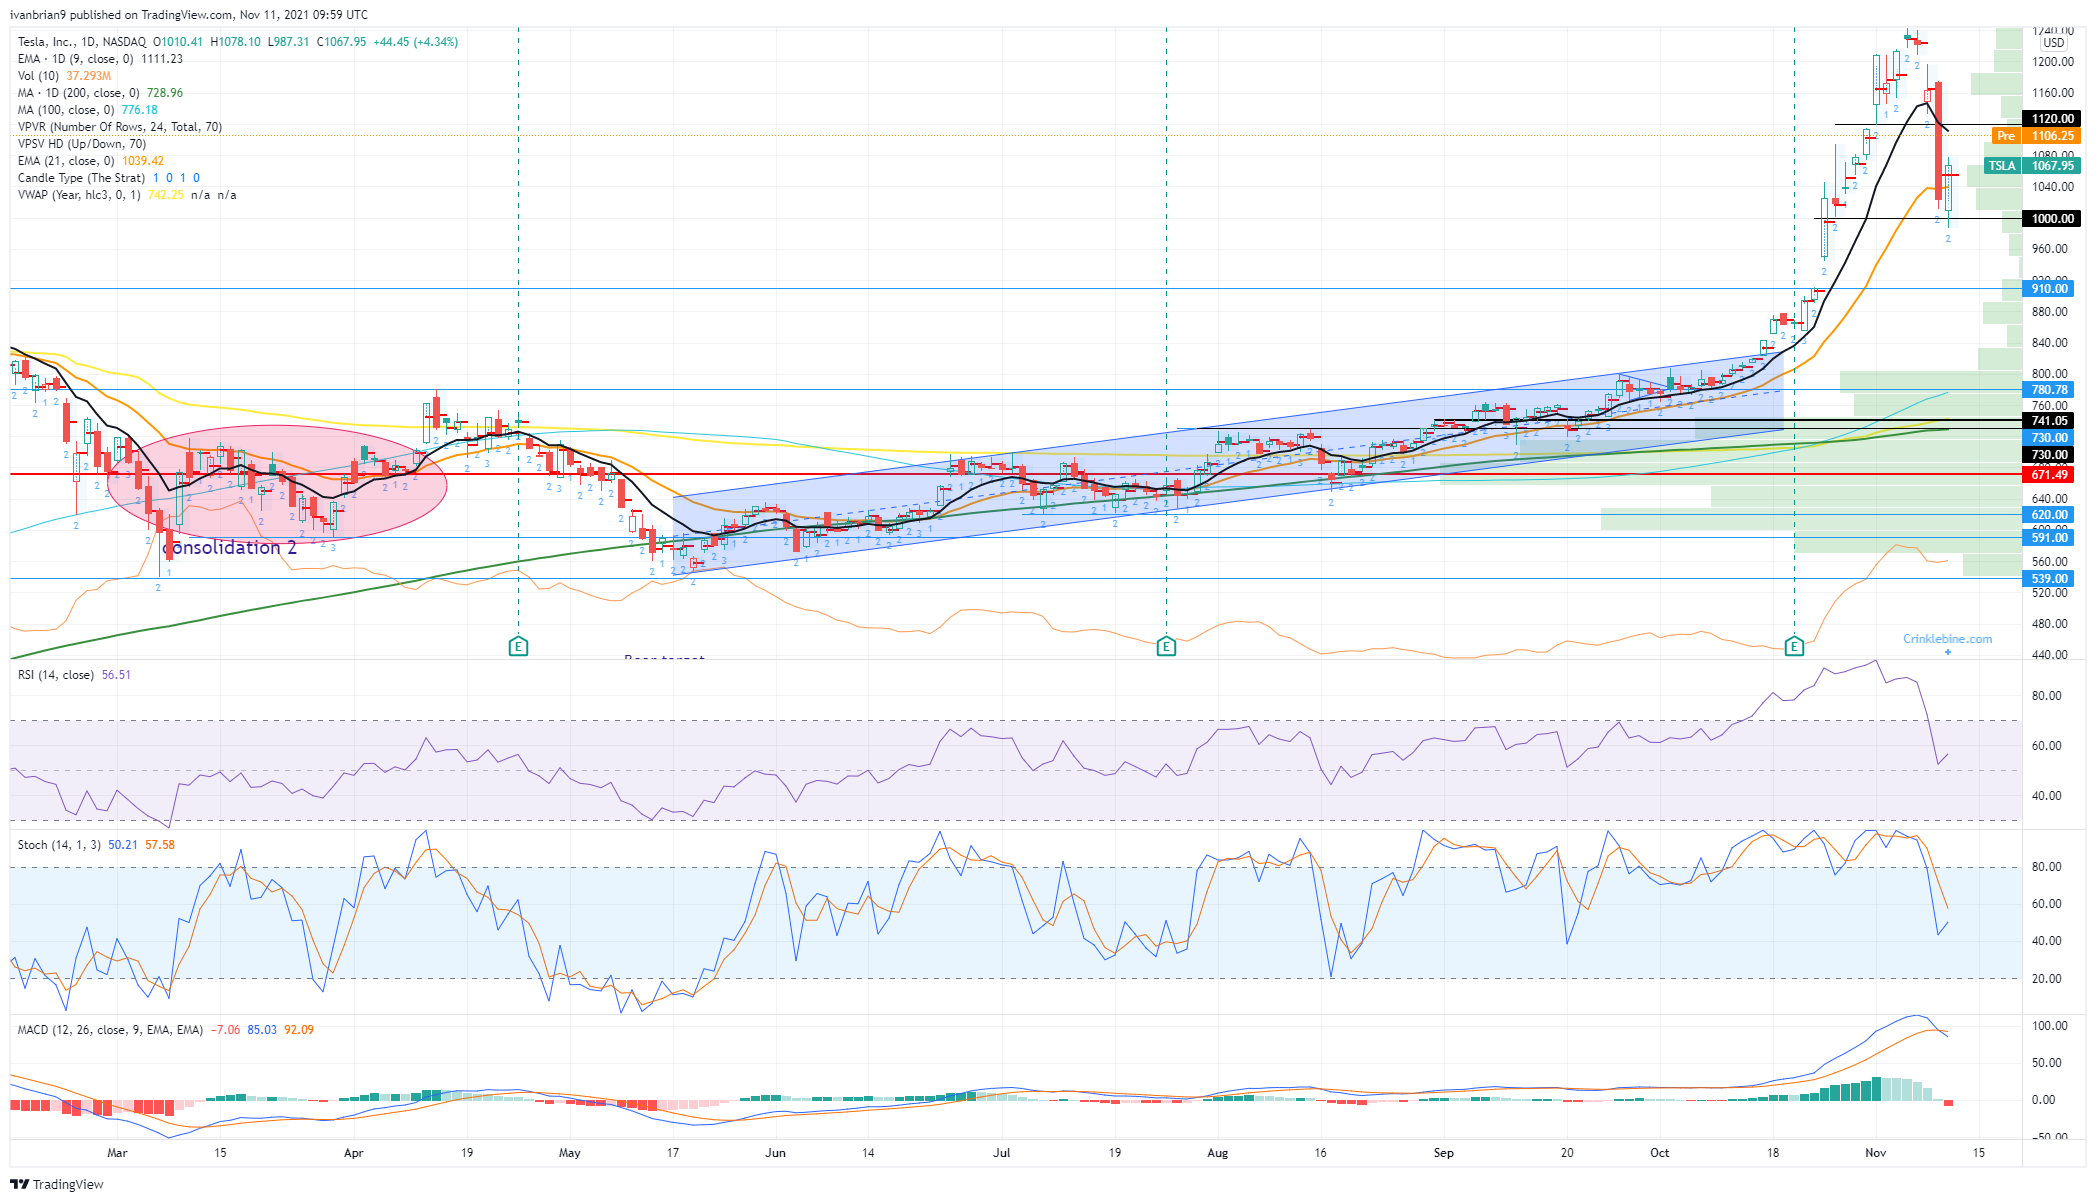
TSLA 1-day chart
Information on these pages contains forward-looking statements that involve risks and uncertainties. Markets and instruments profiled on this page are for informational purposes only and should not in any way come across as a recommendation to buy or sell in these assets. You should do your own thorough research before making any investment decisions. FXStreet does not in any way guarantee that this information is free from mistakes, errors, or material misstatements. It also does not guarantee that this information is of a timely nature. Investing in Open Markets involves a great deal of risk, including the loss of all or a portion of your investment, as well as emotional distress. All risks, losses and costs associated with investing, including total loss of principal, are your responsibility. The views and opinions expressed in this article are those of the authors and do not necessarily reflect the official policy or position of FXStreet nor its advertisers. The author will not be held responsible for information that is found at the end of links posted on this page.
If not otherwise explicitly mentioned in the body of the article, at the time of writing, the author has no position in any stock mentioned in this article and no business relationship with any company mentioned. The author has not received compensation for writing this article, other than from FXStreet.
FXStreet and the author do not provide personalized recommendations. The author makes no representations as to the accuracy, completeness, or suitability of this information. FXStreet and the author will not be liable for any errors, omissions or any losses, injuries or damages arising from this information and its display or use. Errors and omissions excepted.
The author and FXStreet are not registered investment advisors and nothing in this article is intended to be investment advice.
Recommended content
Editors’ Picks

Gold hovers around all-time highs near $3,250
Gold is holding steady near the $3,250 mark, fuelled by robust safe-haven demand, trade war concerns, and a softer-than-expected US inflation gauge. The US Dollar keeps trading with heavy losses around three-year lows.

EUR/USD retreats towards 1.1300 as Wall Street shrugs off trade war headlines
The EUR/USD pair retreated further from its recent multi-month peak at 1.1473 and trades around the 1.1300 mark. Wall Street manages to advance ahead of the weekly close, despite escalating tensions between Washington and Beijing and mounting fears of a US recession. Profit-taking ahead of the close also weighs on the pair.

GBP/USD trims gains, recedes to the 1.3050 zone
GBP/USD now gives away part of the earlier advance to fresh highs near 1.3150. Meanwhile, the US Dollar remains offered amid escalating China-US trade tensions, recession fears in the US, and softer-than-expected US Producer Price data.

Bitcoin, Ethereum, Dogecoin and Cardano stabilze – Why crypto is in limbo
Bitcoin, Ethereum, Dogecoin and Cardano stabilize on Friday as crypto market capitalization steadies around $2.69 trillion. Crypto traders are recovering from the swing in token prices and the Monday bloodbath.

Is a recession looming?
Wall Street skyrockets after Trump announces tariff delay. But gains remain limited as Trade War with China continues. Recession odds have eased, but investors remain fearful. The worst may not be over, deeper market wounds still possible.

The Best brokers to trade EUR/USD
SPONSORED Discover the top brokers for trading EUR/USD in 2025. Our list features brokers with competitive spreads, fast execution, and powerful platforms. Whether you're a beginner or an expert, find the right partner to navigate the dynamic Forex market.