Transurban Group Elliott Wave technical forecast [Video]
![Transurban Group Elliott Wave technical forecast [Video]](https://editorial.fxstreet.com/images/Markets/Equities/hundred-shares-1058243_XtraLarge.jpg)
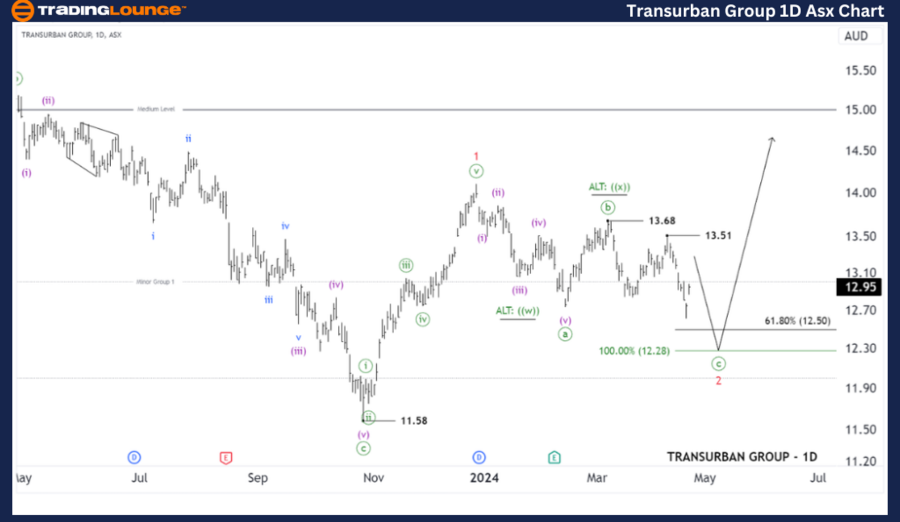
Greetings, Our Elliott Wave analysis today updates the Australian Stock Exchange (ASX) TRANSURBAN GROUP - TCL. We are identifying that TCL has a 2-red wave that opened in the form of a Zigzag, and may soon end, opening up the opportunity to move higher with wave 3-red. We will continuously monitor TCL in the ASX Stocks Top 50 service.
ASX: Transurban Group - TCL Elliott Wave technical analysis
Function: Major trend (Minor degree, red)
Mode: Motive
Structure: Impulse
Position: Wave ((c))-green of Wave 2-red
Latest forecast: Accurate forecast
Details: The short-term outlook indicates that wave 2-red is unfolding, subdividing into waves ((a)) and ((b))-green, which have completed. Now, wave ((c))-green is unfolding, and it appears it will soon conclude, preparing for the resumption of wave 2-red to push higher.
Invalidation point: 11.58
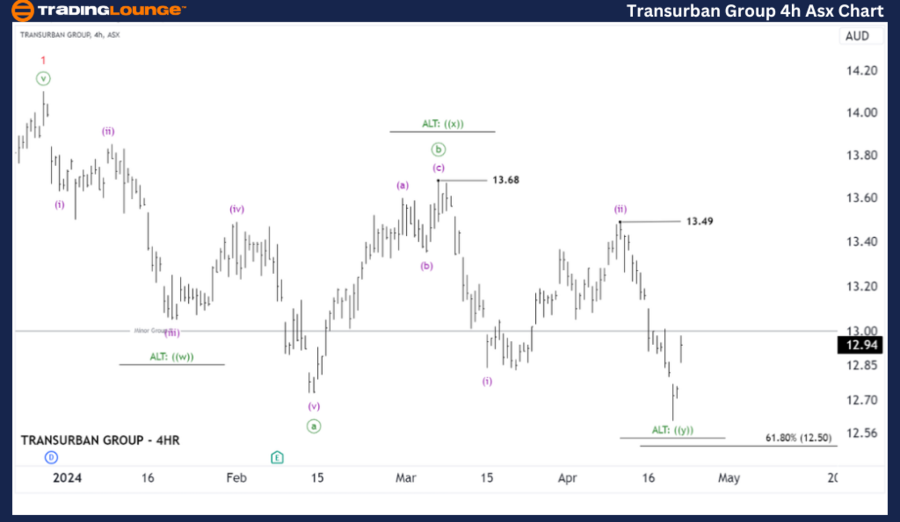
ASX: Transurban Group – TCL four-hour chart analysis
Function: Counter trend (Minute degree, green).
Mode: Corrective.
Structure: Zigzag.
Position: Wave (iii)-purple of Wave ((c))-green.
Details: The short-term outlook suggests that wave 2-red is unfolding, subdividing into either a Zigzag or a Double Zigzag with alternate wave counts. There are some signs indicating that an upward movement may resume, and I will monitor TCL more closely. The overall trend is still bearish, so wave ((c))-green may continue to push lower. However, if the resistance level of 13.49 is surpassed, it will validate the bullish perspective I am mentioning.
Invalidation point: 13.68
Conclusion:
Our analysis, forecast of contextual trends, and short-term outlook for ASX: RIO TRANSURBAN GROUP – TCL aim to provide readers with insights into the current market trends and how to capitalize on them effectively. We offer specific price points that act as validation or invalidation signals for our wave count, enhancing the confidence in our perspective. By combining these factors, we strive to offer readers the most objective and professional perspective on market trends.
Transurban Group Elliott Wave technical forecast [Video]
Author

Peter Mathers
TradingLounge
Peter Mathers started actively trading in 1982. He began his career at Hoei and Shoin, a Japanese futures trading company.


