![]() Elliott Wave Forecast Team
Elliott Wave Forecast Team
ElliottWave-Forecast.com
Today, we will look at the Daily Elliott Wave structure of TransMedics Group Inc. (TMDX) and explain why the stock should soon reach a Blue Box area and react higher.
TransMedics Group, Inc., a commercial-stage medical technology company, engages in transforming organ transplant therapy for end-stage organ failure patients in the United States and internationally. The company was founded in 1998 and is headquartered in Andover, Massachusetts.
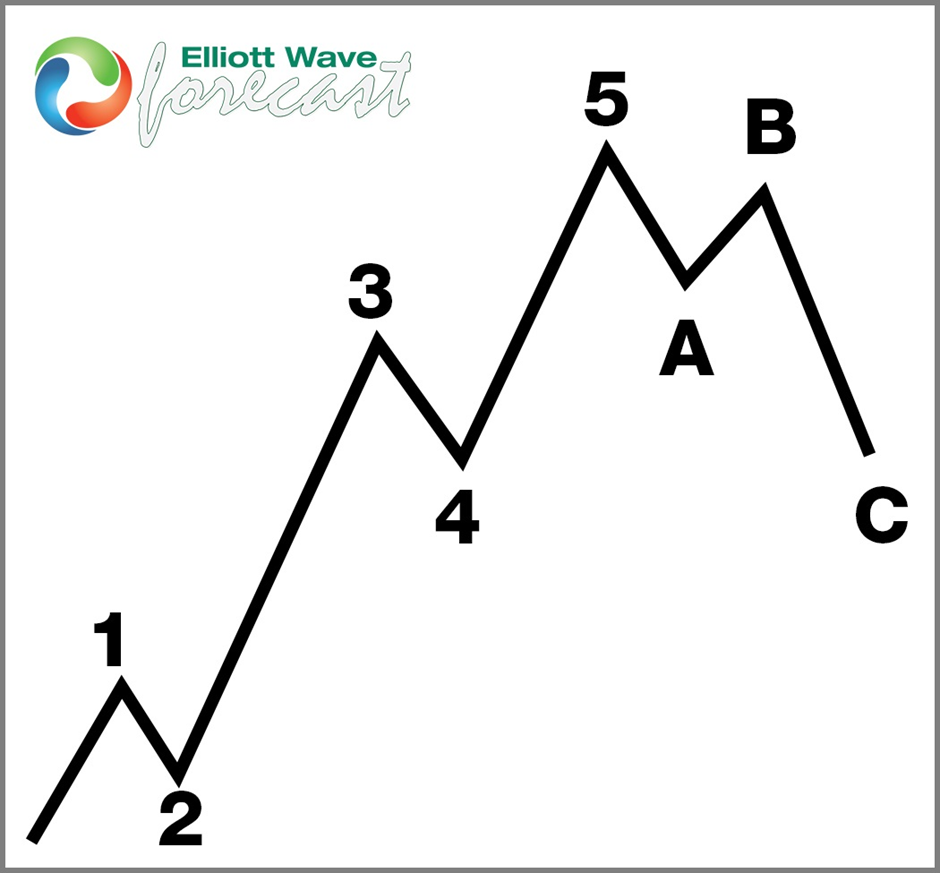
5 Wave impulse structure + ABC correction
TMDX daily Elliott Wave view October 21st 2024:
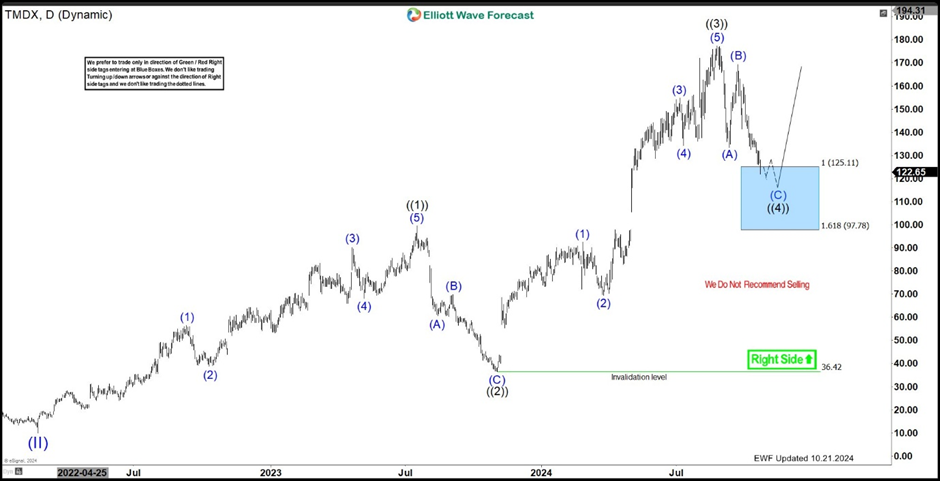
The daily chart of TransMedics Group (TMDX) reveals key patterns based on Elliott Wave Theory. This analysis provides a roadmap for traders to plan their next steps effectively.
Breaking down TMDX’s recent price action
Since the February 2022 low, TMDX has followed a classic 5-wave impulse pattern, indicating a strong trend. Here’s what has happened so far:
- Wave ((1)) ended on July 19, 2023, marking the first impulse.
- Afterward, the stock pulled back in a 3-wave correction (ABC), eventually bottoming out at wave ((2)).
- TMDX then rallied once more, completing wave ((3)) on August 23, 2024.
- Now, wave ((4)) is in progress, and the price is approaching a potential support area known as the Blue Box, which ranges from $125.11 to $97.78.
The blue box: A key area to watch
The Blue Box represents a crucial zone where buyers could step in and start the next rally toward wave ((5)). Typically, corrections occur in 3, 7, or 11 swings, so traders should remain cautious and manage their risk.
Here’s what to keep in mind:
- Stay above the Invalidation Level: As long as the price holds above $97.78, the bullish outlook remains intact. A drop below this level would require a new analysis.
- Avoid Short Selling: The anticipated decline toward the Blue Box might tempt some to sell, but this carries risks. A truncation could occur, cutting the move short. Instead, watch for signs of a bounce in the Blue Box as a signal for the next rally.
Smart risk management
Because the correction could extend into 7 swings, consider taking partial profits on the first bounce. By doing this, you protect some gains and make your remaining position risk-free, setting yourself up for the potential wave ((5)) rally.
Why Elliott Wave theory points to a rally
Elliott Wave Theory helps traders understand market trends and sentiment shifts. In this case, it suggests that once wave ((4)) finishes, TMDX could start a new upward leg, aiming for fresh highs with wave ((5)).
Conclusion
With TMDX nearing a crucial support zone in its Elliott Wave cycle, traders should stay alert for a potential rally. As long as the stock remains above the $97.78 level, the chances of a bullish move increase. Use this analysis to guide your trading strategy and anticipate what’s next.
FURTHER DISCLOSURES AND DISCLAIMER CONCERNING RISK, RESPONSIBILITY AND LIABILITY Trading in the Foreign Exchange market is a challenging opportunity where above average returns are available for educated and experienced investors who are willing to take above average risk. However, before deciding to participate in Foreign Exchange (FX) trading, you should carefully consider your investment objectives, level of xperience and risk appetite. Do not invest or trade capital you cannot afford to lose. EME PROCESSING AND CONSULTING, LLC, THEIR REPRESENTATIVES, AND ANYONE WORKING FOR OR WITHIN WWW.ELLIOTTWAVE- FORECAST.COM is not responsible for any loss from any form of distributed advice, signal, analysis, or content. Again, we fully DISCLOSE to the Subscriber base that the Service as a whole, the individual Parties, Representatives, or owners shall not be liable to any and all Subscribers for any losses or damages as a result of any action taken by the Subscriber from any trade idea or signal posted on the website(s) distributed through any form of social-media, email, the website, and/or any other electronic, written, verbal, or future form of communication . All analysis, trading signals, trading recommendations, all charts, communicated interpretations of the wave counts, and all content from any media form produced by www.Elliottwave-forecast.com and/or the Representatives are solely the opinions and best efforts of the respective author(s). In general Forex instruments are highly leveraged, and traders can lose some or all of their initial margin funds. All content provided by www.Elliottwave-forecast.com is expressed in good faith and is intended to help Subscribers succeed in the marketplace, but it is never guaranteed. There is no “holy grail” to trading or forecasting the market and we are wrong sometimes like everyone else. Please understand and accept the risk involved when making any trading and/or investment decision. UNDERSTAND that all the content we provide is protected through copyright of EME PROCESSING AND CONSULTING, LLC. It is illegal to disseminate in any form of communication any part or all of our proprietary information without specific authorization. UNDERSTAND that you also agree to not allow persons that are not PAID SUBSCRIBERS to view any of the content not released publicly. IF YOU ARE FOUND TO BE IN VIOLATION OF THESE RESTRICTIONS you or your firm (as the Subscriber) will be charged fully with no discount for one year subscription to our Premium Plus Plan at $1,799.88 for EACH person or firm who received any of our content illegally through the respected intermediary’s (Subscriber in violation of terms) channel(s) of communication.
Recommended content
Editors’ Picks

EUR/USD holds steady above 1.0800, looks to post weekly losses
EUR/USD trades marginally higher on the day above 1.0800 after the data from the US showed that Durable Goods Orders declined by 0.8% in September. Nevertheless, the pair remains on track to close the fourth consecutive week in negative territory.

GBP/USD extends recovery to 1.3000 area
GBP/USD extends its recovery and trades at around 1.3000 in the American session on Friday. The US Dollar struggles to gather strength as the market mood remains positive heading into the weekend, allowing the pair to hold its ground.

Gold fluctuates in narrow range below $2,750
Gold stays in a consolidation phase and fluctuates in a relatively tight range below $2,750 on Friday. US Treasury bond yields stabilize in the American session, making it difficult for XAU/USD to gather directional momentum.

Crypto Today: XRP, Bitcoin and Ethereum decline as Ripple files response to SEC appeal
XRP loses over 1.30% as Ripple's executive confirms the filing of an important document in the appeals process in the SEC lawsuit. Bitcoin corrects less than 1% and sustains above $67,500. Ethereum is down nearly 0.20%, holding above the key support level of $2,500.

US elections: The race to the White House tightens
Trump closes in on Harris’s lead in the polls. Neck and neck race spurs market jitters. Outcome still hinges on battleground states.

Best Forex Brokers with Low Spreads
VERIFIED Low spreads are crucial for reducing trading costs. Explore top Forex brokers offering competitive spreads and high leverage. Compare options for EUR/USD, GBP/USD, USD/JPY, and Gold.