TLS Elliott Wave technical forecast [Video]
![TLS Elliott Wave technical forecast [Video]](https://editorial.fxstreet.com/images/Markets/Equities/Industries/Insurance/pic-signing-contract-637435374858445846_XtraLarge.jpg)
ASX: TELSTRA GROUP LIMITED - TLS Elliott Elliott Wave Technical Analysis TradingLounge.
Greetings, Our Elliott Wave analysis today updates the Australian Stock Exchange (ASX) with TELSTRA GROUP LIMITED - TLS. We see that wave (2)-orange may have ended, and TLS.ASX may be preparing for a long-term increase with wave (3)-orange.
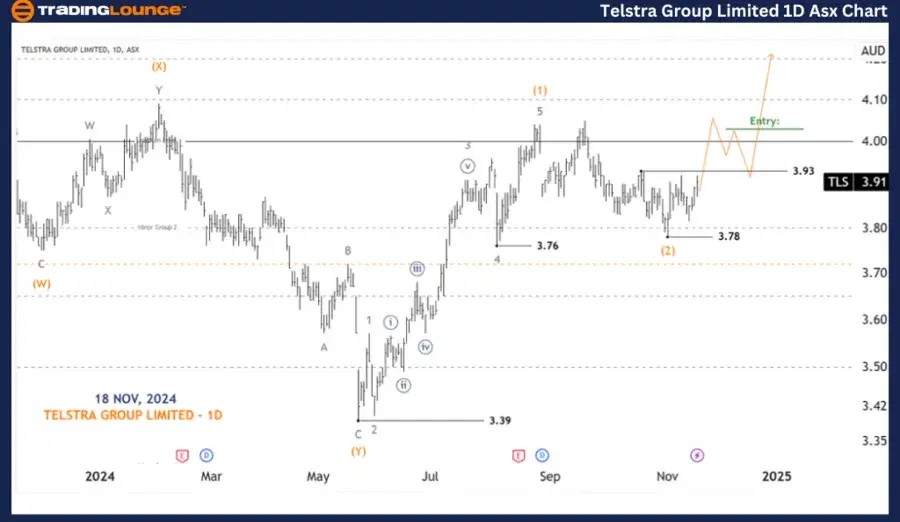
ASX: Telstra Group Limited - TLS one-day chart (semilog scale) analysis
Function: Major trend (Intermediate degree, orange).
Mode: Motive.
Structure: Impulse.
Position: Wave (3)-orange of Wave ((3))-navy.
Details: Some evidence has shown that wave (2)-orange may have ended, and wave (3)-orange is unfolding. The fact that price pushed up one more time and then found support at 4.00 adds weight to the bull market view, and towards higher levels like 5.00.
Invalidation point: 3.39.
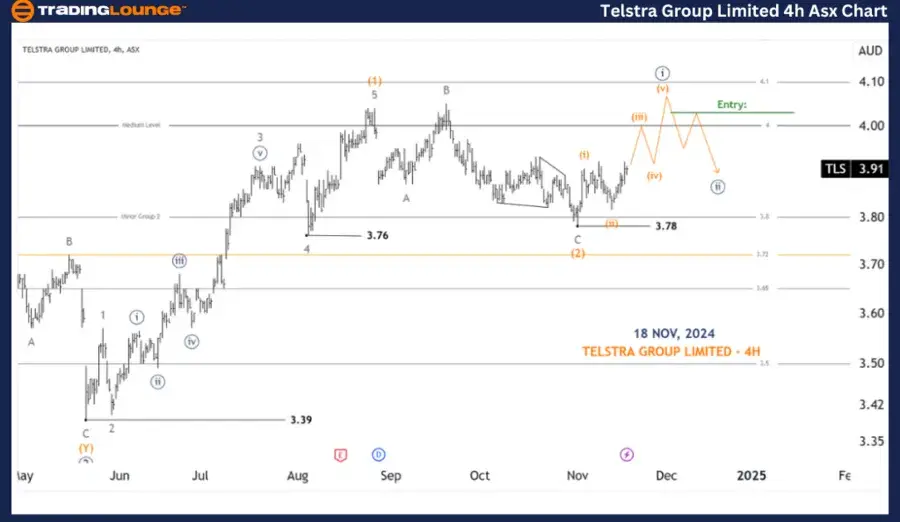
ASX: Telstra Group Limited - TLS four-hour chart analysis
Function: Major trend (Minuette degree, navy).
Mode: Motive.
Structure: Impulse.
Position: Wave (iii)-orange of Wave ((i))-navy.
Details: Since the low at 3.78, wave (2)-orange may have completed, and wave (3)-orange is unfolding. It is moving higher, and it is close to completing wave ((i))-navy labeled from wave (i)-orange to wave (v)-orange. Then wave ((ii))-navy will push lower, and finally wave ((iii))-navy will return to push higher. The long trade setup will be of high quality when the 4.00 level becomes tested support and then we will go long.
Invalidation point: 3.78.
Conclusion:
Our analysis, forecast of contextual trends, and short-term outlook for ASX: TELSTRA GROUP LIMITED - TLS aim to provide readers with insights into the current market trends and how to capitalize on them effectively. We offer specific price points that act as validation or invalidation signals for our wave count, enhancing the confidence in our perspective. By combining these factors, we strive to offer readers the most objective and professional perspective on market trends.
Technical analyst: Hua (Shane) Cuong, CEWA-M (Master’s Designation).
ASX: Telstra Group Limited - TLS chart analysis [Video]
Author

Peter Mathers
TradingLounge
Peter Mathers started actively trading in 1982. He began his career at Hoei and Shoin, a Japanese futures trading company.


