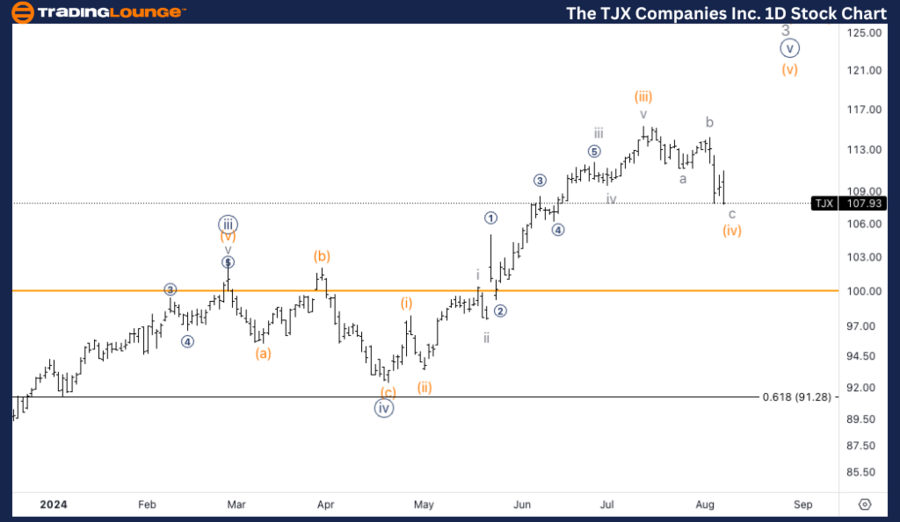
TJX Elliott Wave Analysis Trading Lounge Daily Chart,
The TJX Companies Inc., (TJX) Daily Chart
TJX Elliott Wave technical analysis
Function: Trend.
Mode: Impulsive.
Structure: Motive.
Position: Wave {v} of 3.
Direction: Top in wave {v}.
Details: Looking for further upside into wave {v}, knowing we could also have a top in wave {v} in place, and we are now entering a deeper correction in Minor wave 4.
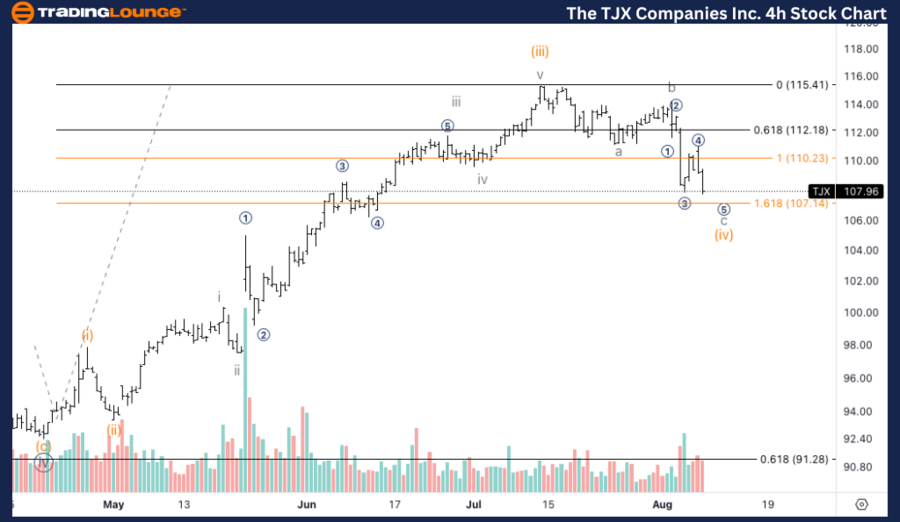
TJX Elliott Wave Analysis Trading Lounge 4H Chart,
The TJX Companies Inc., (TJX) 4H Chart
TJX Elliott Wave technical analysis
Function: Trend.
Mode: Impulsive.
Structure: Motive.
Position: Sub minuette wave c.
Direction: Bottom in wave c.
Details: Looking for one more leg lower into wave c, as volume seems to be suggesting buyer may be entering the market.
Welcome to our latest Elliott Wave analysis for The TJX Companies Inc. (TJX). This analysis provides an in-depth look at TJX's price movements using the Elliott Wave Theory, helping traders identify potential opportunities based on current trends and market structure. We will cover insights from both the daily and 4-hour charts to offer a comprehensive perspective on TJX's market behavior.
TJX Elliott Wave technical analysis – Daily chart
We are looking for further upside into wave {v}, acknowledging the possibility that a top in wave {v} might already be in place. This scenario would imply an imminent deeper correction in Minor wave 4. Traders should be cautious and watch for signs of a potential top forming.
TJX Elliott Wave technical analysis – Four-hour chart
The 4-hour chart indicates the potential for one more leg lower into wave c. Volume analysis suggests that buyers may be entering the market, which could signify a bottom forming in wave c. This would align with the anticipated completion of the corrective structure, leading to a resumption of the upward trend.
Technical analyst: Alessio Barretta.
TJX Elliott Wave technical analysis [Video]
As with any investment opportunity there is a risk of making losses on investments that Trading Lounge expresses opinions on.
Historical results are no guarantee of future returns. Some investments are inherently riskier than others. At worst, you could lose your entire investment. TradingLounge™ uses a range of technical analysis tools, software and basic fundamental analysis as well as economic forecasts aimed at minimizing the potential for loss.
The advice we provide through our TradingLounge™ websites and our TradingLounge™ Membership has been prepared without considering your objectives, financial situation or needs. Reliance on such advice, information or data is at your own risk. The decision to trade and the method of trading is for you alone to decide. This information is of a general nature only, so you should, before acting upon any of the information or advice provided by us, consider the appropriateness of the advice considering your own objectives, financial situation or needs. Therefore, you should consult your financial advisor or accountant to determine whether trading in securities and derivatives products is appropriate for you considering your financial circumstances.
Recommended content
Editors’ Picks
EUR/USD trims early gains and hovers around 1.0920 ahead of US data
![EUR/USD trims early gains and hovers around 1.0920 ahead of US data](https://editorial.fxstreet.com/images/Markets/Currencies/Majors/EURUSD/euro-coins-gm520443967-49899402_XtraSmall.jpg)
EUR/USD trimmed early gains and trades just above its daily opening in the European session on Thursday. Market participants await United States macroeconomic data and Fedspeak for near-term guidance in an otherwise sentiment-driven environment.
USD/JPY recovers above 146.00 amid risk aversion
![USD/JPY recovers above 146.00 amid risk aversion](https://editorial.fxstreet.com/images/Markets/Currencies/Majors/USDJPY/crumpled-us-and-japanese-currency-13375743_XtraSmall.jpg)
USD/JPY has trimmed losses to regain 146.00 in European trading on Thursday. BoJ's hawkish Summary of Opinions and a risk-off market mood continue to underpin the Japanese Yen, checking the upside attempts in the pair. The focus shifts to US employment data.
Gold price steadies on Middle East conflict, firm Fed rate-cut prospects
![Gold price steadies on Middle East conflict, firm Fed rate-cut prospects](https://editorial.fxstreet.com/images/Markets/Commodities/Metals/Gold/stacked-gold-bars-13094022_XtraSmall.jpg)
Gold’s price (XAU/USD) slightly recovers from a two-day low of $2,380 in Thursday’s European session. The precious metal continues to hold ground due to expectations that the Fed will start reducing interest rates from the September meeting.
Bitcoin price poised for a potential relief rally before continuing its current downtrend
![Bitcoin price poised for a potential relief rally before continuing its current downtrend](https://editorial.fxstreet.com/images/Markets/Currencies/Digital%20Currencies/Bitcoin/Bitcoin_Book_XtraSmall.jpg)
Bitcoin's (BTC) price is recovering from initial weekly losses after a 7% drop on Monday, trading 3.8% higher at $57,245 at the time of writing on Thursday.
Blaring the bear market siren
![Blaring the bear market siren](https://editorial.fxstreet.com/images/TechnicalAnalysis/Positioning/bear-market-gm182744280-13137293_XtraSmall.jpg)
The market may long for a peaceful passage, but we're gearing up for what looks to be more akin to a rollercoaster expedition. Prepare for a potentially "Turbulent Thursday" and brace for what might become a "Frantic Friday."